

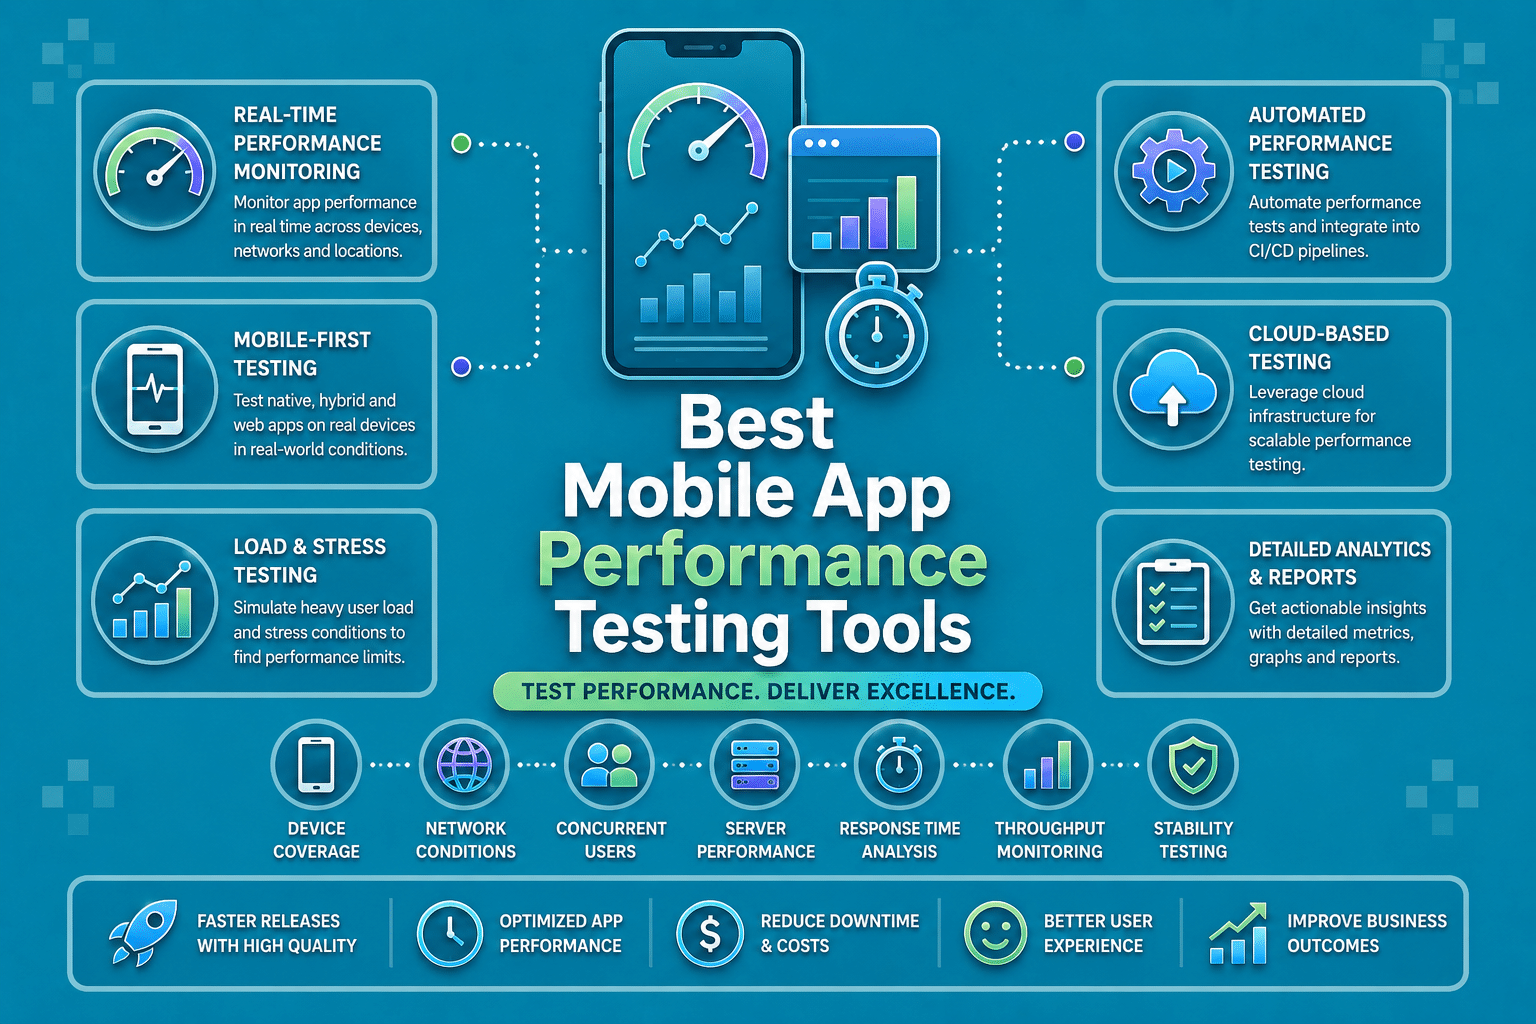

Mobile users are ruthless. Research shows that 53% of them abandon an app that takes more than three seconds to load, and nearly 90% will stop using it entirely after repeated performance issues.
For development teams, that means performance testing isn’t a nice-to-have, it’s what keeps users from churning and stores from tanking your ratings.
The problem is that most teams test performance too late, too manually, and without the right tools.
This guide covers the 10 best mobile app performance testing tools in 2026: what they measure, who they’re built for, and where each one fits in your mobile QA stack.
Key Tools
- Panto AI: AI-driven mobile app performance testing for CI/CD teams enforcing budgets on every pull request.
- Firebase Performance Monitoring: Free production performance monitoring for Android and iOS teams using the Google ecosystem.
- Android Profiler: Built-in Android performance testing tool for developers needing deep local diagnostics and profiling.
- Xcode Instruments: Apple’s native iOS performance testing suite for precise profiling during app development.
- BrowserStack App Performance: Real-device cloud testing platform for measuring mobile app performance across large device matrices.
- Apptim: Lightweight mobile app benchmarking tool for quick visual comparisons on Android and iOS devices.
- Apache JMeter: Open-source load testing tool for validating backend API performance behind mobile apps.
- k6 by Grafana: Developer-friendly API load testing tool built for JavaScript workflows and CI integration.
- New Relic Mobile: Production mobile APM platform for monitoring crashes, launches, and user experience in real time.
- Instabug: In-app feedback and performance monitoring tool for teams tracking real-user issues after release.
10 Best Mobile App Performancing Testing Tools in 2026
1. Panto AI — Best for AI-Driven Mobile Performance Testing with CI Integration
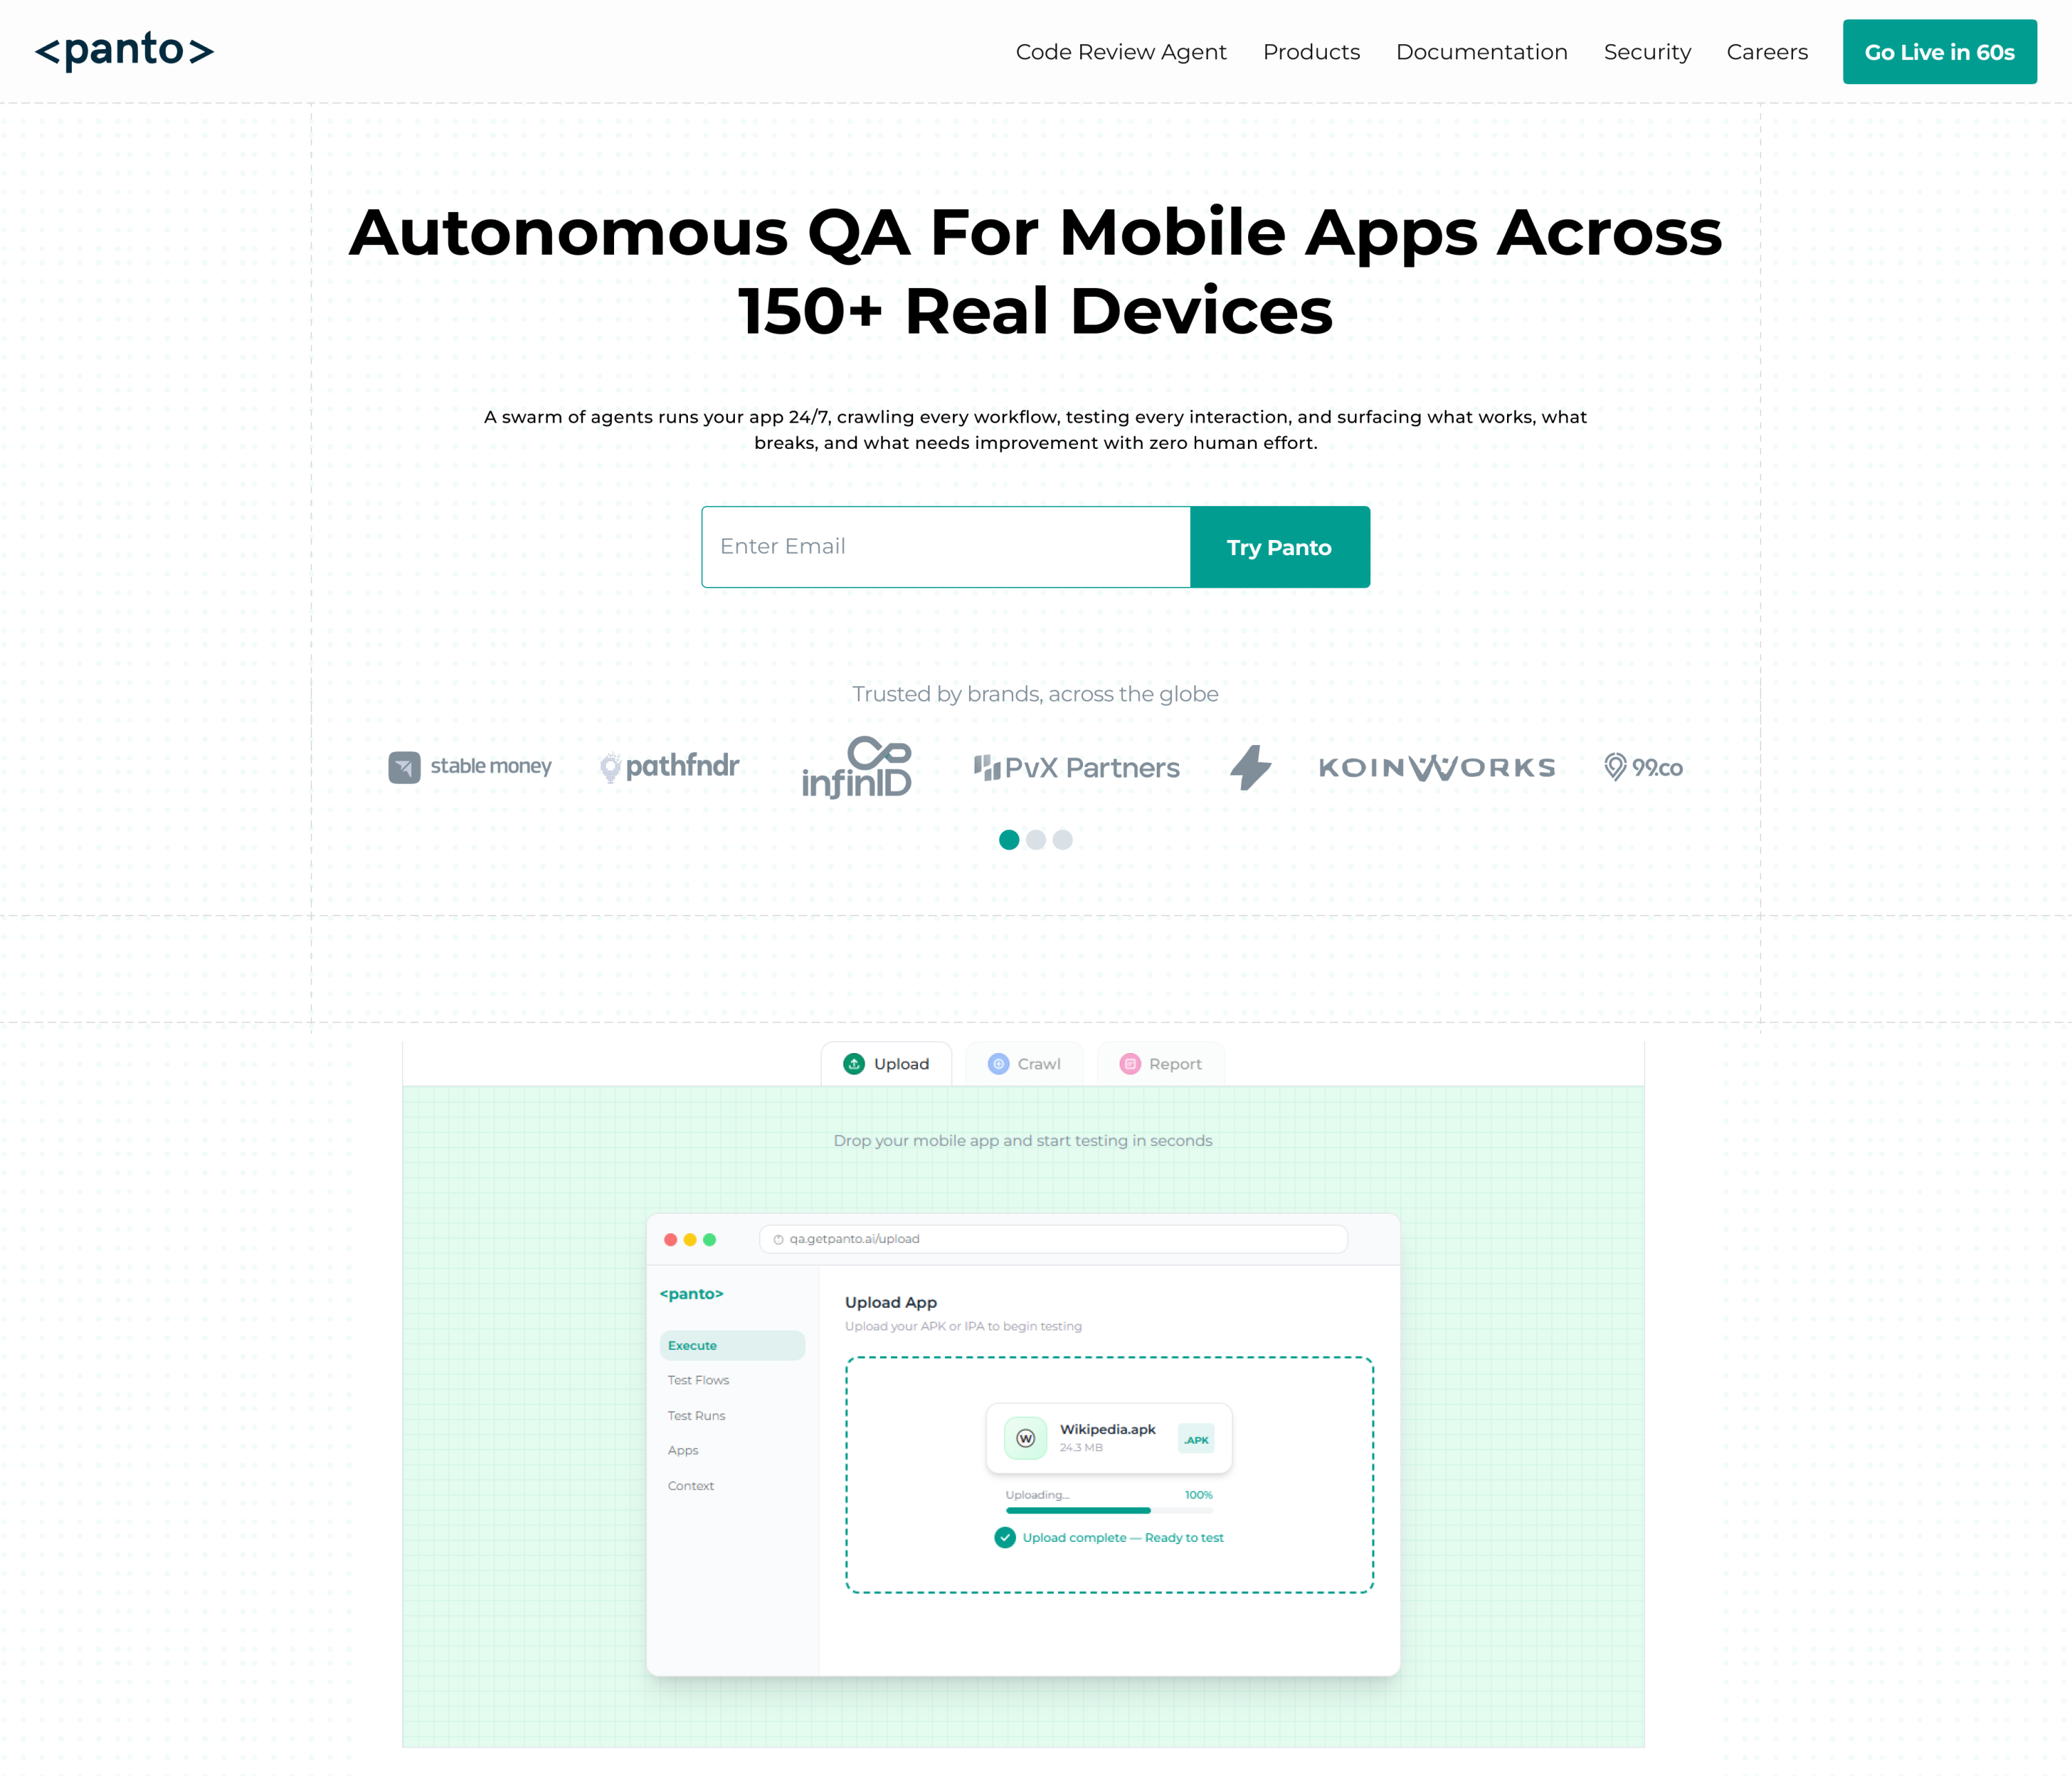
Best for: Engineering teams that ship mobile apps fast and need performance regressions caught at the PR level, before they reach production.
Panto AI’s automated performance testing platform takes a fundamentally different approach from most tools on this list. Rather than requiring you to run manual test suites at the end of a sprint, Panto integrates directly into your CI/CD pipeline and enforces performance budgets on every pull request.
If a commit causes CPU usage to spike or memory to climb beyond a defined threshold, the PR fails automatically, the same way a linting or unit test failure would.
What Panto measures
On the mobile side, Panto runs performance jobs on both real devices and emulators to capture:
- CPU and memory usage under simulated carrier network conditions
- Battery impact — especially critical for fintech and social apps where background processes compound drain
- WebView rendering performance — including PWA install flows, offline recovery, and media playback
- App start time across cold, warm, and hot launch states
- Frame rate and UI responsiveness tied to specific commits, so you know exactly which change caused a regression
Where it stands out
The AI layer is what separates Panto from tools that just surface metrics. Machine learning detects anomalous regressions, clusters similar failure patterns across test runs, and surfaces the most likely root causes, down to the code location and third-party resource timing.
Every failing run captures full request traces, CPU flamegraphs, heap snapshots, and video playback, so your team can triage in minutes rather than hours.
Panto also supports canary testing on PRs, heavier runs on staging, and full-scope pre-release tests, all in the same platform, without needing to configure separate tools for each phase.
Integrations: GitHub, GitLab, Bitbucket, Azure DevOps, self-hosted/on-premise
Pricing: See pricing page
2. Firebase Performance Monitoring — Best Free Option for Android and iOS
Best for: Teams already on the Google ecosystem who want lightweight production performance monitoring at no cost.
Firebase Performance Monitoring is Google’s native APM solution, embedded directly into the Firebase SDK. It collects real-user data from production apps, which makes it genuinely useful for catching performance issues that only surface under real-world traffic conditions, and not just in controlled tests.
Key metrics
- HTTP/S request latency broken down by endpoint
- App start time (cold and hot launch)
- Screen rendering rates (slow and frozen frames)
- Custom traces for any code path you define
Limitations to know
Firebase is a monitoring tool, not a load or stress testing tool. It tells you what happened in production, but it won’t help you simulate traffic spikes, test under network throttling, or gate PRs before release. It’s best used alongside a pre-release testing tool rather than as a replacement.
Pricing: Free
Platform: Android, iOS
3. Android Profiler (Android Studio) — Best Built-in Tool for Android Native Apps
Best for: Android developers who want deep, granular performance diagnostics during development without adding any external tooling.
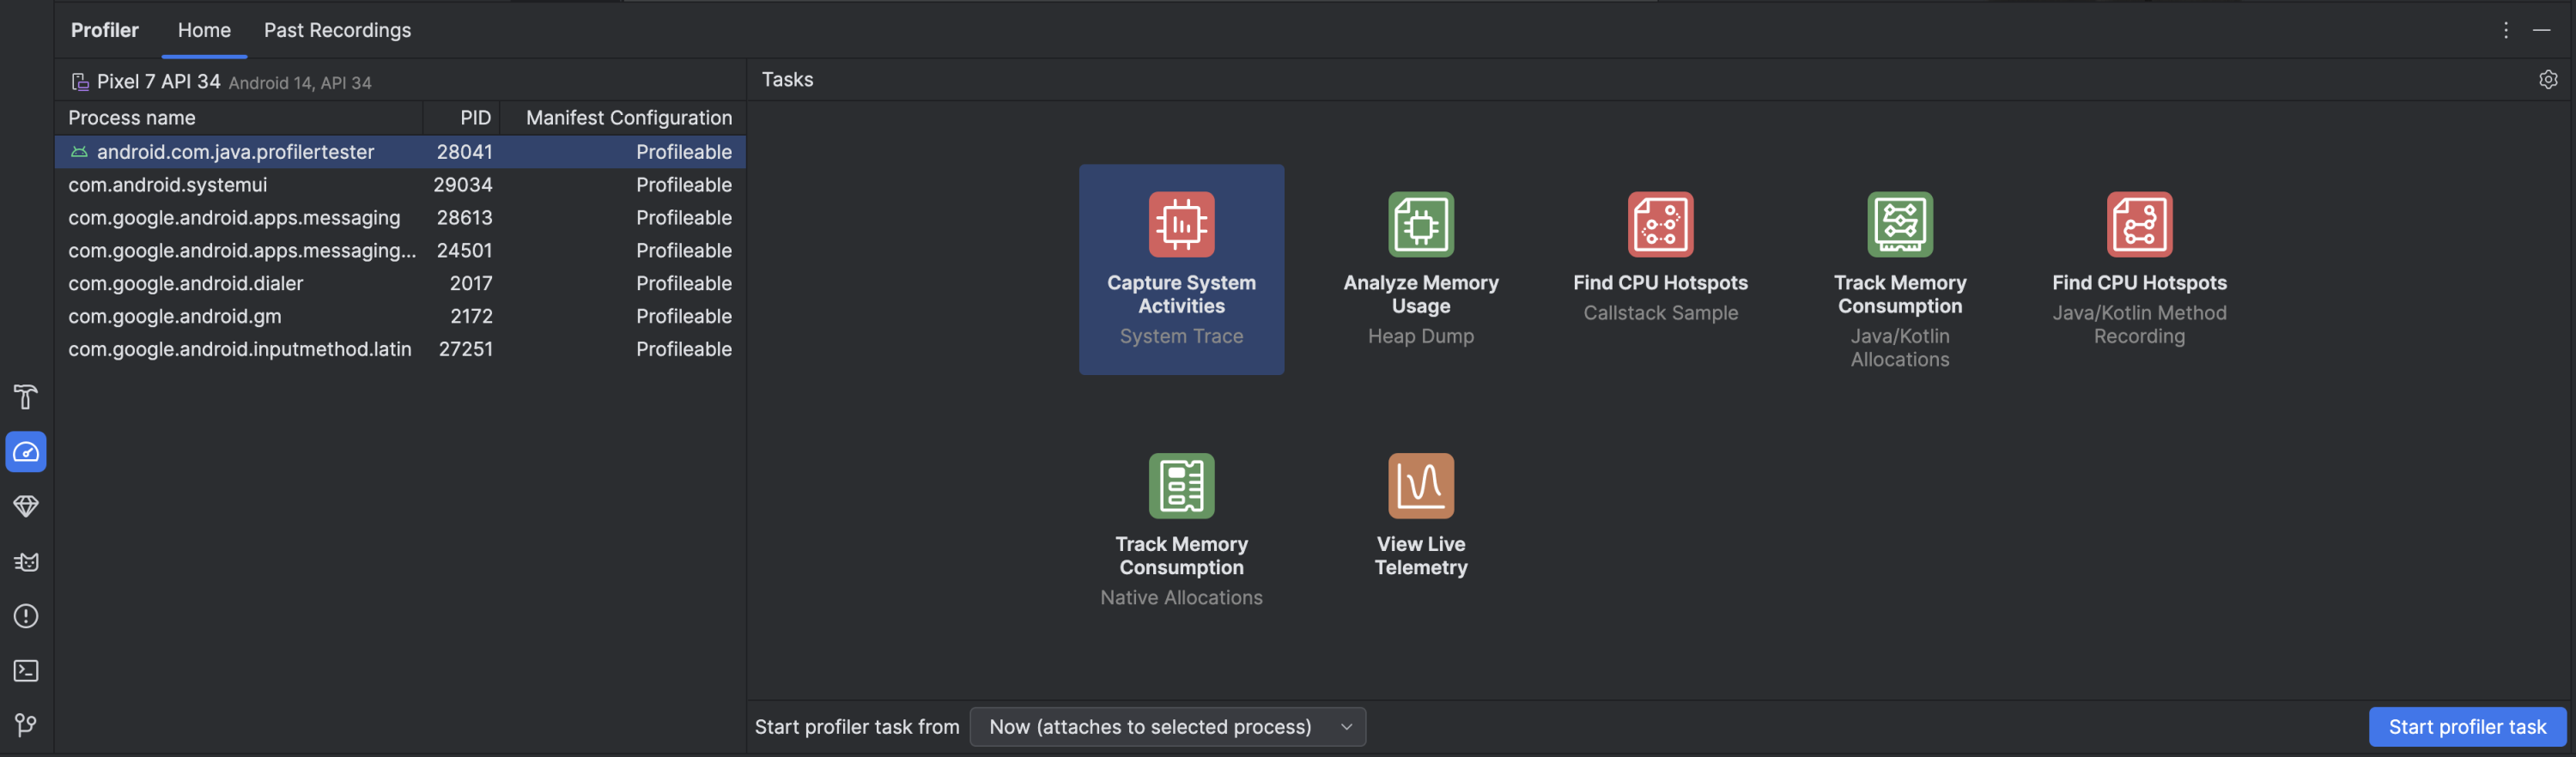
Android Profiler is bundled with Android Studio and gives you real-time, frame-by-frame visibility into what your mobile app is doing. It’s the most precise tool available for diagnosing Android-specific issues because it reads directly from the device’s hardware counters.
What it covers
- CPU Profiler — method-level call stacks, thread activity, and system traces; supports both Java/Kotlin and native C++ profiling
- Memory Profiler — heap dumps, allocation tracking, garbage collection events, and memory leak detection
- Energy Profiler — battery drain attribution by system wake locks, alarms, and jobs
- Network Profiler — request/response payloads and timing for all network calls
Where it falls short
Android Profiler is a development-time tool. It has no CI integration, no cloud running capability, no historical trend tracking across builds, and no real-device cloud; you’re profiling on a connected device or emulator in your local environment. For anything beyond local diagnostics, you need something else.
Pricing: Free (bundled with Android Studio)
Platform: Android only
4. Xcode Instruments — Best Built-in Tool for iOS Native Apps
Best for: iOS developers who need deep, Apple-native performance profiling during development.
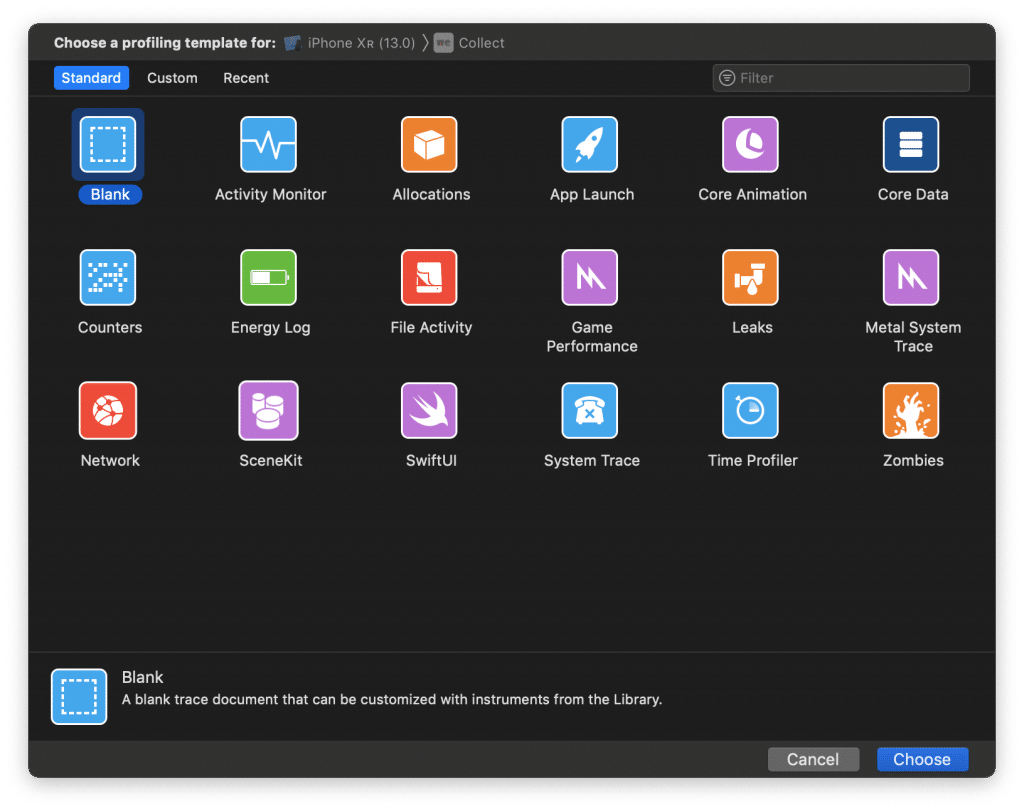
Xcode Instruments is Apple’s equivalent to Android Profiler. It is a comprehensive suite of profiling tools built into Xcode. It’s the authoritative source for iOS performance diagnostics because it has direct access to system-level APIs and hardware metrics unavailable to third-party tools.
Key instruments
- Time Profiler — CPU usage by call stack, helping you find exactly where cycles are being wasted
- Allocations — memory allocation history and heap growth over time
- Leaks — runtime memory leak detection with stack traces
- Core Animation — frame rate, GPU usage, and rendering pipeline analysis for smooth UI
- Network — URL session and WebSocket request timing and payload inspection
Limitations
Like Android Profiler, Instruments is a local development tool with no CI/CD integration, no cloud device support, and no cross-platform and cross-build trend tracking. It’s indispensable for diagnosing specific iOS performance bugs, but it’s not a complete performance testing strategy.
Pricing: Free (bundled with Xcode)
Platform: iOS only
5. BrowserStack App Performance — Best for Real-Device Cloud Testing at Scale
Best for: QA teams that need to test performance across a large matrix of real Android and iOS devices without maintaining device labs.
BrowserStack App Performance runs your native Android and iOS apps on BrowserStack’s cloud of thousands of real devices. You upload your build (IPA, APK, or AAB) and it runs performance analysis across your chosen device matrix.
What it measures
- App start time across cold and warm launches
- CPU and memory usage under scripted user flows
- Network call timing and payload analysis
- UI responsiveness and frame rendering
Strengths and trade-offs
The main advantage of BrowserStack is breadth. You can test on hundreds of real device/OS combinations without buying or maintaining physical hardware. The main trade-off is cost; at scale, the pricing can climb quickly, and the depth of root-cause analysis is more limited than dedicated profiling tools like Android Profiler or Xcode Instruments.
BrowserStack pairs well with Panto for teams that want both granular CI-integrated performance budgeting (Panto) and broad real-device matrix testing (BrowserStack).
Pricing: Paid plans; pricing on request
Platform: Android, iOS
6. Apptim — Best for Lightweight Mobile Performance Benchmarking
Best for: Small teams and individual developers who need a quick, visual way to compare app performance builds without a complex setup.
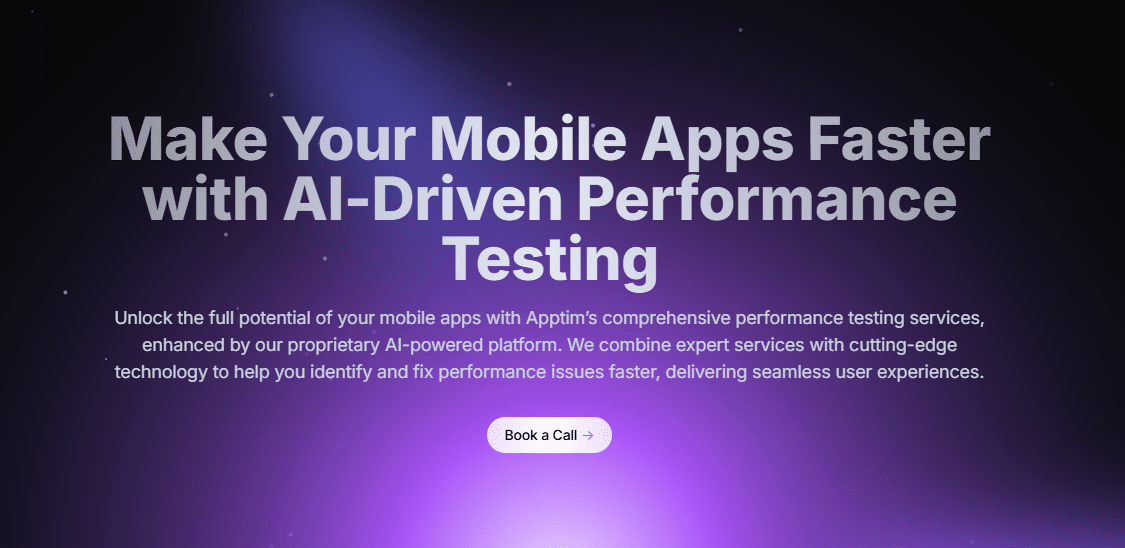
Apptim connects to a physical device (Android via USB, iOS via Xcode) and collects performance data during manual or automated test sessions. It’s designed to be accessible, the UI is simple, the setup is minimal, and it generates shareable reports that non-technical stakeholders can read.
What it covers
- CPU and memory usage during test sessions
- Frame rate and rendering performance
- Battery consumption
- App crashes and ANRs (Application Not Responding events)
- Side-by-side build comparison reports
Limitations
Apptim is a profiling and benchmarking tool, not a load or stress tester. It doesn’t integrate into CI pipelines natively, doesn’t run tests on cloud devices, and isn’t built for team-scale workflows. It’s a strong choice for individual developers wanting quick build-to-build comparisons, but it won’t replace a full performance testing setup for a team.
Pricing: Free tier available; paid plans for advanced features
Platform: Android, iOS
7. Apache JMeter — Best Open-Source Load Testing for Backend APIs

Best for: Teams that need free, scriptable, distributed load testing for the backend APIs that power their mobile apps.
JMeter is one of the most established open-source load testing tools available. While it doesn’t test the mobile app client itself, it’s widely used to load test the backend API layer, simulating thousands of concurrent mobile users hitting your endpoints to measure throughput, error rates, and latency under pressure.
Key capabilities
- Distributed load generation across multiple machines
- Supports HTTP, HTTPS, WebSocket, JDBC, LDAP, and more
- Scriptable via GUI or XML test plans
- Extensible plugin ecosystem
- CI integration via command-line mode and plugins (Jenkins, GitLab CI, GitHub Actions)
What to be aware of
JMeter requires significant setup and scripting expertise. It has no mobile-native client, no device profiling, and no AI-assisted analysis. For teams comfortable with Java and load testing concepts, it’s powerful and free. For teams that want something faster to get started with, managed alternatives like Panto’s load testing module or k6 may be a better fit.
Pricing: Free (open-source)
Platform: Platform-agnostic (API/backend focus)
8. k6 by Grafana — Best Developer-Friendly Load Testing for API Backends
Best for: Engineering teams that want modern, JavaScript-based load testing with clean CI integration and cloud scaling.
k6 is a developer-centric load testing tool from Grafana Labs. Tests are written in JavaScript (not XML like JMeter), making them easier to read, version-control, and integrate into existing development workflows. k6 also has a managed cloud version that handles distributed load generation without requiring you to manage your own infrastructure.
Key features
- JavaScript-based test scripts (much more maintainable than JMeter XML)
- Built-in metrics: response time, throughput, error rate, data received/sent
- Thresholds — fail tests when SLOs are breached (similar to performance budgets)
- Native CI integration (GitHub Actions, GitLab CI, Jenkins, CircleCI)
- k6 Cloud for distributed load and results dashboarding
Where it fits
Like JMeter, k6 tests your API backend, not the mobile client itself. It’s the right tool for validating that your server can handle traffic spikes before a major launch, or for regression-testing API performance as part of your CI pipeline. Pair it with a mobile-native tool for end-to-end performance coverage.
Pricing: Open-source (free); k6 Cloud has paid tiers
Platform: Platform-agnostic (API/backend focus)
9. New Relic Mobile — Best for Production APM and Crash Monitoring
Best for: Teams that need comprehensive Application Performance Monitoring (APM) in production, with crash analysis and distributed tracing.
New Relic Mobile is an enterprise APM platform with dedicated mobile SDKs for Android and iOS. Unlike pre-release testing tools, it’s designed to monitor real user sessions in production and alert your team when performance degrades.
What it monitors
- Crash rates with full stack traces and session replays
- HTTP request performance by endpoint
- App launch time (real users, not synthetic)
- Custom event tracking and user interaction timings
- Mobile vitals: memory, CPU, network, and battery correlated with user actions
Trade-offs
New Relic is a powerful and expensive production monitoring platform. The pricing model (based on data ingested and seats) can escalate quickly for high-volume apps. It’s also primarily a reactive tool, it tells you what went wrong after it went wrong in production. For pre-release performance gates and CI-level budgets, you need something like Panto alongside it.
Pricing: Usage-based; free tier available with limits
Platform: Android, iOS
10. Instabug — Best for In-App Feedback + Performance Crash Reporting

Best for: Mobile teams who want to combine user-reported bug feedback with automated crash and performance monitoring in a single SDK.
Instabug embeds a lightweight SDK into your mobile app that lets users shake their device (or tap a trigger) to send feedback, screenshots, and session data directly to your team. Alongside that, it provides automated crash reporting, performance monitoring, and network request logging.
Performance capabilities
- App launch time tracking
- Network request timing and error rates
- UI hang detection (frozen screens and ANRs)
- Crash reporting with full device context (OS, device model, memory state)
- Release tracking to correlate performance changes with deploys
Where it fits
Instabug is strongest as a user-feedback and crash intelligence tool with performance monitoring as a complement, rather than a primary performance testing platform. It doesn’t run pre-release load tests or enforce CI performance budgets, but it’s excellent for teams that want to quickly understand what real users are experiencing in production.
Pricing: Paid plans; pricing on request
Platform: Android, iOS, React Native, Flutter, Xamarin
Side-by-Side Comparison of Mobile App Performance Testing Tools
| Tool | Mobile Client | API / Backend | CI/CD | Real Devices | AI Analysis | Free Tier |
|---|---|---|---|---|---|---|
| Panto AI | Yes | Yes | Native | Yes | Yes | No |
| Firebase Performance | Production | No | No | Real users | No | Yes |
| Android Profiler | Yes | No | No | Local only | No | Yes |
| Xcode Instruments | Yes | No | No | Local only | No | Yes |
| BrowserStack App Performance | Yes | No | Yes | Cloud | No | No |
| Apptim | Yes | No | No | Local only | No | Yes |
| Apache JMeter | No | Yes | Yes | No | No | Yes |
| k6 | No | Yes | Yes | No | No | Yes |
| New Relic Mobile | Production | Yes | Yes | Real users | Partial | Limited |
| Instabug | Production | Partial | No | Real users | No | No |
How to Choose the Right Tool
You need a complete performance testing strategy, not a single tool. In practice, most teams use 2–3 tools in combination:
- Pre-release testing (CI gates): Panto AI — enforce performance budgets on every PR, catch regressions before they merge
- Deep local debugging: Android Profiler or Xcode Instruments — diagnose specific issues at the method level during development
- Backend load testing: k6 or JMeter — validate that your API layer can handle traffic spikes before major releases
- Production monitoring: Firebase Performance or New Relic — watch for real-user regressions and crash spikes post-deploy
Conclusion
Performance testing for mobile apps has matured significantly. The best teams no longer treat it as a pre-release checklist — they treat it as a continuous gate baked into every pull request.
The tools that enable this shift, specifically AI-native platforms like Panto AI that integrate performance budgets directly into CI/CD, are what separate teams that ship confidently from teams that discover problems from one-star reviews.
Start with your biggest gap: if you’re catching performance regressions in production, work backwards into pre-release CI testing. If you’re already testing manually pre-release, automate it. If you’re already automated, add AI-driven root cause analysis to cut triage time.
FAQ’S
Q: What metrics matter most for mobile app performance testing?
A: The most important metrics are app start time, frame rate, memory usage, CPU consumption, and network latency. Cold app launch should generally stay under 2 seconds, while smooth UI interactions should maintain 60fps or higher. Teams also rely on performance budgets in CI/CD pipelines so builds automatically fail when metrics exceed acceptable thresholds.
Q: What is the difference between load testing and mobile app performance testing?
A: Load testing measures backend scalability by simulating large numbers of concurrent users hitting APIs and services. Mobile app performance testing focuses on the client-side experience — including rendering speed, CPU usage, memory consumption, battery impact, and responsiveness on real devices. A complete testing strategy typically includes both.
Q: Can I do mobile app performance testing for free?
A: Yes. Tools like Android Profiler, Xcode Instruments, JMeter, k6, Firebase Performance Monitoring, and Apptim offer free tiers or open-source capabilities for performance testing. The trade-off is that most free tools lack advanced features like CI/CD orchestration, cloud device farms, historical trend analysis, and AI-assisted root cause detection.
Q: How does AI improve mobile app performance testing?
A: AI improves performance testing through anomaly detection and automated root cause analysis. Instead of relying only on fixed thresholds, AI systems can identify regressions that fall outside normal performance variance and correlate them with likely code changes or infrastructure issues. Platforms like Panto AI also prioritize failures and surface remediation guidance, reducing the time required to investigate regressions.