

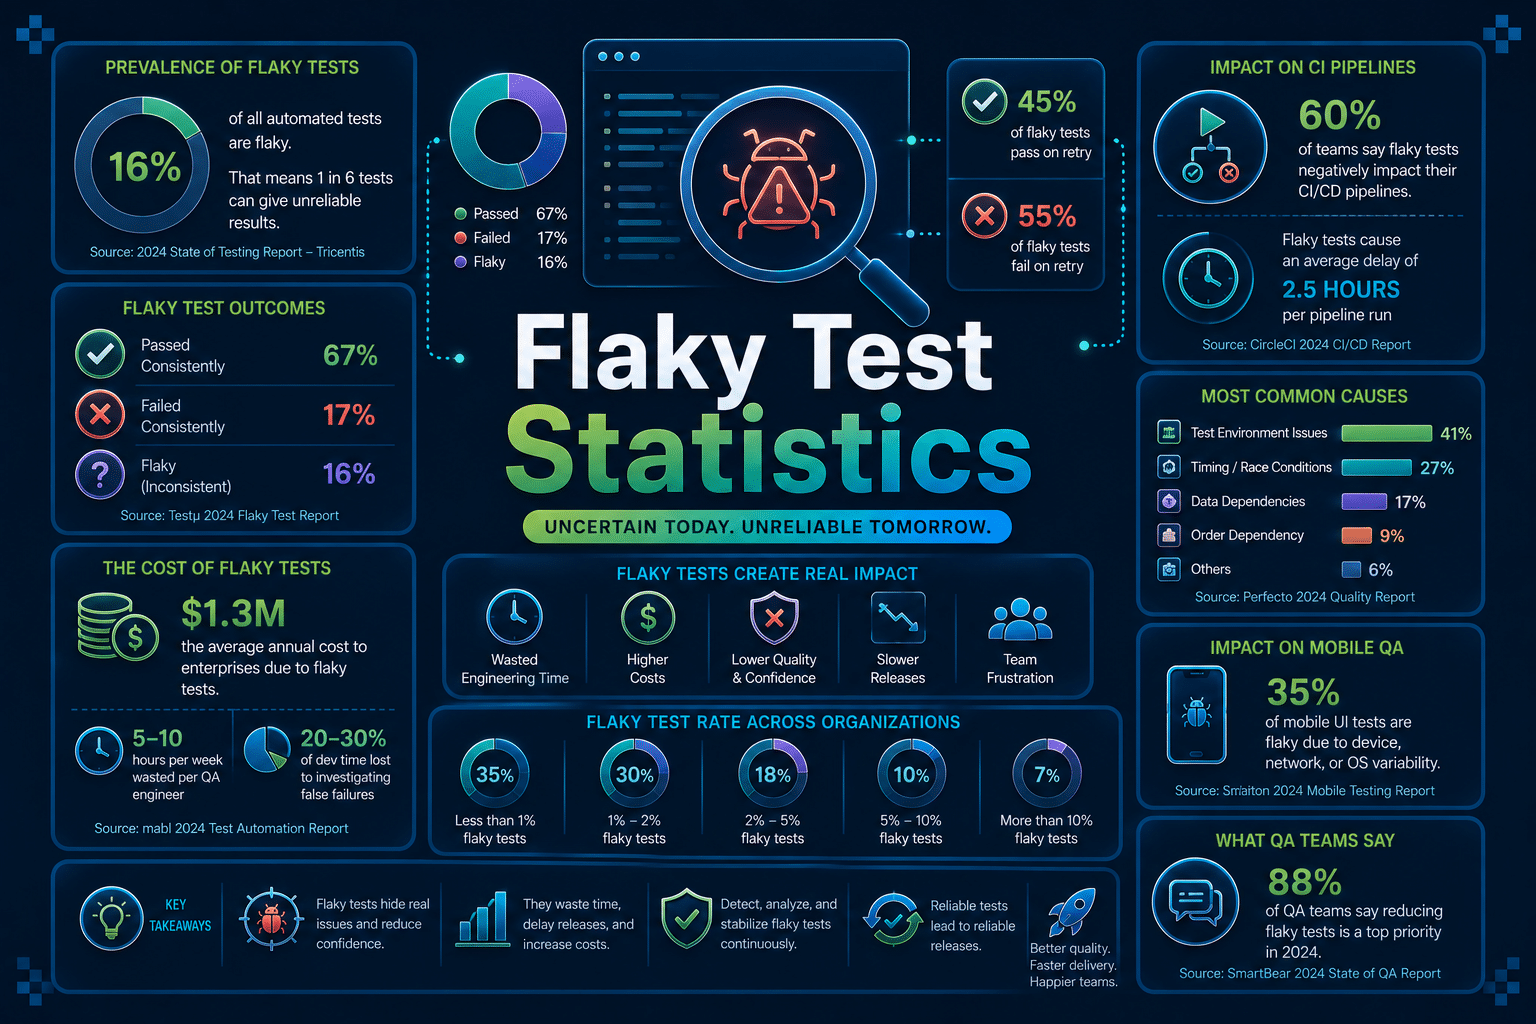

Google has reported that 16% of its 4.2 million tests show some level of flakiness, and that 84% of pass-to-fail transitions in its CI system are flaky, not real bugs.
Across the industry, Bitrise’s 2025 Mobile Insights report found the share of teams experiencing test flakiness grew from 10% in 2022 to 26% in 2025.
Flaky tests are automated tests that pass and fail on the same code without any change.
They are one of the most measurable, best-studied reliability problems in software engineering, with data going back to Google’s original 2016 research and continuing through peer-reviewed studies published this year.
This article compiles verified flaky test statistics for 2026, covering prevalence, root causes, financial and time cost, detection accuracy, AI-based repair, and market growth.
Flaky Test Statistics: Key Insights and Takeaways
- 16% of Google’s 4.2 million tests show some level of flakiness, based on Google’s own published CI research.
- Teams experiencing test flakiness rose from 10% in 2022 to 26% in 2025, a 160% increase, according to Bitrise’s analysis of over 10 million builds.
- Atlassian estimates 150,000 developer hours are lost per year to flaky tests across its engineering organization.
Slack cut its test-related CI failure rate from 56.76% to 3.85% after investing in dedicated flaky test remediation.
45% of flaky test fixes address async and timing issues, the single largest root cause identified in academic research. - AI-based repair tools now fix 47.6% of reproducible flaky tests automatically, with over half of those fixes accepted by developers.
At A Glance: Flaky Test Statistics 2026
| Metric | Figure |
|---|---|
| Google test flakiness rate | 16% of all tests |
| Google pass-to-fail transitions that are flaky | 84% |
| Microsoft build flakiness rate | 26% of sampled builds |
| Teams experiencing flakiness, 2022 to 2025 | 10% to 26% |
| GitHub commits hitting a flaky red build (2020) | 9% (1 in 11) |
| Atlassian developer hours lost annually | 150,000 hours |
| Slack CI failure rate before and after remediation | 56.76% to 3.85% |
| Top root cause of flaky test fixes | 45% async/timing issues |
| AI repair rate for reproducible flaky tests | 47.6% |
| Meta E2E test flakiness vs. unit tests | ~10% vs. under 1% |
Flaky Test Statistics: A Deep Dive
1. Flaky Test Statistics: Prevalence Statistics
Flakiness is not a niche problem confined to a few unlucky teams. It shows up consistently across companies of very different sizes and testing maturity levels.
Google’s foundational research, first published by John Micco in 2016 and still widely cited today, found that almost 16% of Google’s 4.2 million tests showed some level of flakiness.
Google also reported that developers on its platform spend between 2% and 16% of total compute resources simply re-running flaky tests to confirm results.
Microsoft’s internal research identified flaky failures in 26% of sampled builds across its large-scale CI systems, a figure cited in multiple later academic papers, including the 2024 FlaKat study.
GitHub’s own 2020 engineering data showed that 1 in 11 commits (9%) triggered at least one red build caused specifically by a flaky test, not a real code issue.
| Source | Flakiness Metric | Value | Year |
|---|---|---|---|
| Tests with some flakiness | 16% | 2016 | |
| Pass-to-fail transitions that are flaky | 84% | 2016 | |
| Microsoft | Sampled builds with flaky failures | 26% | Cited 2024 |
| GitHub | Commits with a flaky red build | 9% | 2020 |
| Open source study (1,960 Java projects) | Projects affected by flaky builds | 51.28% | Feb 2025 |
| Same study | Rerun builds showing flaky behavior | 67.73% | Feb 2025 |
| Same study | Total builds that are rerun | 3.2% | Feb 2025 |
| Slack | CI failures from test job failures (before fix) | 56.76% | 2022 |
A separate 2025 academic study analyzed 1,960 open source Java projects using GitHub Actions and found that 51.28% of all projects were affected by flaky builds, with 67.73% of rerun builds showing flaky behavior once teams triggered a retry.
Industry-wide, the trend is moving in the wrong direction.
Bitrise’s 2025 Mobile Insights report, based on over 10 million CI builds tracked across 3.5 years, found that the proportion of teams experiencing test flakiness climbed from 10% in 2022 to 26% in 2025,.
This is a 160% increase, while CI pipeline complexity grew 23% over the same period.
2. Flaky Test Statistics: Causes Statistics
Understanding what actually causes flaky tests matters more than knowing they exist. Academic research has isolated specific, repeatable categories rather than treating flakiness as random noise.
The most cited study on flaky test causes comes from Luo et al. (FSE 2014), which analyzed 201 flaky test fixes across 51 Apache open source projects.
That research found 45% of all fixes addressed asynchronous wait and timing issues, making it by far the single largest cause category.
A later ICSE 2021 study focused specifically on UI-driven tests and found that async-wait issues accounted for roughly 45% of UI-specific flaky failures as well, reinforcing timing as the dominant root cause across both backend and frontend test types.
| Root Cause Category | Share of Flaky Test Fixes |
|---|---|
| Async wait / timing issues | 45% |
| Concurrency (data races, deadlocks) | 16% of studied commits |
| Test order dependency | 9% of studied commits |
| Resource leak | 5% of studied commits |
Owain Parry’s survey of flaky test research (published in ACM TOSEM, 2021) categorized causes across multiple open source codebases, including the Home Assistant project.
That analysis found 16% of relevant commits fell under the concurrency category, covering thread interaction issues like data races and deadlocks, with a further 9% under test order dependency and 5% under resource leaks.
A separate finding from Parry’s 2025 follow-up research adds an operational insight: roughly 75% of flaky tests cluster around a shared underlying root cause, meaning fixing one infrastructure or timing issue can resolve more than a dozen flaky tests at once rather than requiring test-by-test fixes.
3. Flaky Test Statistics: Time and Compute Statistics
Flaky tests carry a real, quantifiable cost in both engineering hours and compute spend, not just an abstract drag on morale.
Atlassian’s engineering team estimated in 2025 that flaky tests cost the organization 150,000 developer hours per year. That figure comes from tracking investigation time, re-runs, and delayed merges across its internal CI systems.
A 2024 industrial case study, published at ICST 2024 by Leinen et al., measured actual developer time spent at a mid-sized engineering organization.
It found a team of roughly 30 developers spent 2.5% of total productive time dealing with flaky tests, including 1.3% specifically on repair work.
Slack’s engineering team published some of the clearest before-and-after data available.
Before investing in dedicated flaky test detection and suppression tooling, 56.76% of Slack’s CI failures were test job failures, a combination of flaky and genuinely broken tests.
After remediation, that number dropped to under 4% (3.85%).
| Company or Study | Cost Metric | Value |
|---|---|---|
| Atlassian | Developer hours lost annually | 150,000 hours |
| ICST 2024 case study | Productive time spent on flaky tests (30-dev team) | 2.5% |
| Same study | Time spent specifically on repair | 1.3% |
| Compute resources spent re-running flaky tests | 2% to 16% | |
| Slack | CI failure rate before remediation | 56.76% |
| Slack | CI failure rate after remediation | 3.85% |
Google’s own figures on compute cost are notable at scale.
The company has reported spending between 2% and 16% of its total test compute resources purely on re-running tests to determine whether a failure was real or flaky.
4. Flaky Test Statistics: Test Types
Flakiness is not evenly distributed across test types. End-to-end and UI tests are consistently the least reliable category.
Meta’s engineering data shows that its end-to-end tests run at approximately 10% flakiness, while unit tests on the same codebases stay well under 1%.
That roughly tenfold gap reflects how much more surface area E2E tests expose to timing, network, and environment variance compared to isolated unit tests.
A Chromium CI study (Lampel et al., ESEC/FSE 2023) offers a useful caution about detection accuracy at this test-type level.
Its flakiness prediction model reached 99.2% precision in identifying flaky tests, yet still misclassified 76.2% of genuine fault-triggering failures as flaky.
The same study found an average of 250 flaky tests per build, against just 1 fault-revealing test per failing build, and that fault-revealing failures occurred in 24.15% of all studied builds.
| Test Type | Approximate Flakiness Rate |
|---|---|
| Unit tests | Under 1% |
| End-to-end (E2E) tests | ~10% |
| Chromium CI, average flaky tests per build | 250 |
| Chromium CI, fault-revealing tests per failing build | 1 |
5. Flaky Test Statistics: AI and Automated Flaky Test Detection Statistics
AI-based tools are now being measured against flaky test detection and repair with published, peer-reviewed benchmarks, not just vendor claims.
FlakyGuard, presented at ASE 2025, demonstrated that AI could automatically repair 47.6% of reproducible flaky tests, with 51.8% of those AI-generated fixes accepted by developers without further changes.
The approach treats test code as a graph structure and selectively explores relevant context rather than rewriting entire test files.
A separate ICSE 2024 study measured large language models specifically on categorized flaky test types.
It found LLMs successfully repaired 79% of order-dependent flaky tests and 58% of implementation-dependent flaky tests, showing meaningfully different success rates depending on the underlying cause.
Check out our complete report on LLM Statistics →
| AI Detection or Repair Study | Result |
|---|---|
| FlakyGuard reproducible test repair rate | 47.6% |
| FlakyGuard developer acceptance of AI fixes | 51.8% |
| LLM repair rate, order-dependent flakes | 79% |
| LLM repair rate, implementation-dependent flakes | 58% |
| Chromium flakiness predictor precision | 99.2% |
| Same model, real bugs misclassified as flaky | 76.2% |
Google’s own root-cause localization research, tested across 428 internal projects, reported 82% accuracy in automatically identifying the code-level location responsible for a test’s flaky behavior, well before generative AI models entered the picture.
6. Flaky Test Statistics: Market Trends
The financial and tooling response to flaky tests is scaling alongside the problem itself.
Industry estimates place the AI-enabled software testing market at $1.01 billion in 2025, projected to reach $4.64 billion by 2034, a compound annual growth rate of roughly 18.3%.
This figure should be treated as a market research estimate rather than a company-reported number, and reflects the broader AI-assisted testing category rather than flaky test tooling alone.
That growth tracks closely with the underlying problem.
Bitrise’s data shows CI pipeline complexity increased 23% between 2022 and 2025, the same window in which team-level flakiness rates jumped from 10% to 26%.
As pipelines add more parallel jobs, more integrations, and more automated test suites, the raw surface area for flaky behavior expands with it.
Conclusion
The data is consistent across companies, academic studies, and years. Flaky tests affect somewhere between 16% and 26% of tests or builds at major engineering organizations.
They cost real money too, 150,000 lost developer hours at Atlassian alone. And they trace back overwhelmingly to async and timing issues, not exotic edge cases.
The trend line is also clear. Bitrise’s longitudinal data shows the share of teams affected grew 160% between 2022 and 2025, even as CI tooling and AI-assisted testing matured.
For engineering and QA leaders, the numbers point toward the same conclusion. Flaky tests are not a gap that better discipline alone will close.
They are a measurable, growing tax on CI infrastructure that scales with pipeline complexity. AI-based repair and QA tools are starting to close part of that gap, fixing close to half of reproducible flaky tests automatically.
But detection accuracy studies like the Chromium research show these systems still misclassify a meaningful share of real bugs as noise.
The organizations narrowing the gap fastest, like Slack cutting failure rates from 56.76% to 3.85%, treat flakiness as a tracked, budgeted engineering metric rather than background noise.
Frequently Asked Questions
What percentage of tests are flaky? Google reports that 16% of its 4.2 million tests show some level of flakiness. Microsoft’s internal data found flaky failures in 26% of sampled builds, and an open source study of 1,960 GitHub Actions projects found 51.28% of projects affected by flaky builds.
What is the biggest cause of flaky tests? Async and timing issues are the largest documented cause, responsible for 45% of flaky test fixes according to Luo et al.’s FSE 2014 study of 51 Apache projects, a figure echoed by a separate 2021 ICSE study on UI-specific flakiness.
How much do flaky tests cost engineering teams? Atlassian estimates 150,000 developer hours lost annually. A separate 2024 industrial case study found a 30-developer team spent 2.5% of total productive time on flaky tests, including 1.3% on repair work alone.
Can AI fix flaky tests automatically? Yes, with measured limits. FlakyGuard (ASE 2025) automatically repaired 47.6% of reproducible flaky tests, with 51.8% of fixes accepted by developers. LLM-based repair performs better on order-dependent flakes (79%) than implementation-dependent ones (58%).
Are flaky tests getting better or worse over time? Worse, according to the best available longitudinal data. Bitrise found the share of teams experiencing flakiness grew from 10% in 2022 to 26% in 2025, a 160% increase, even as CI tooling has improved.
Do all test types flake at the same rate? No. Meta’s data shows end-to-end tests flake at roughly 10%, compared to under 1% for unit tests, reflecting the larger surface area E2E tests expose to timing and environment variance.