

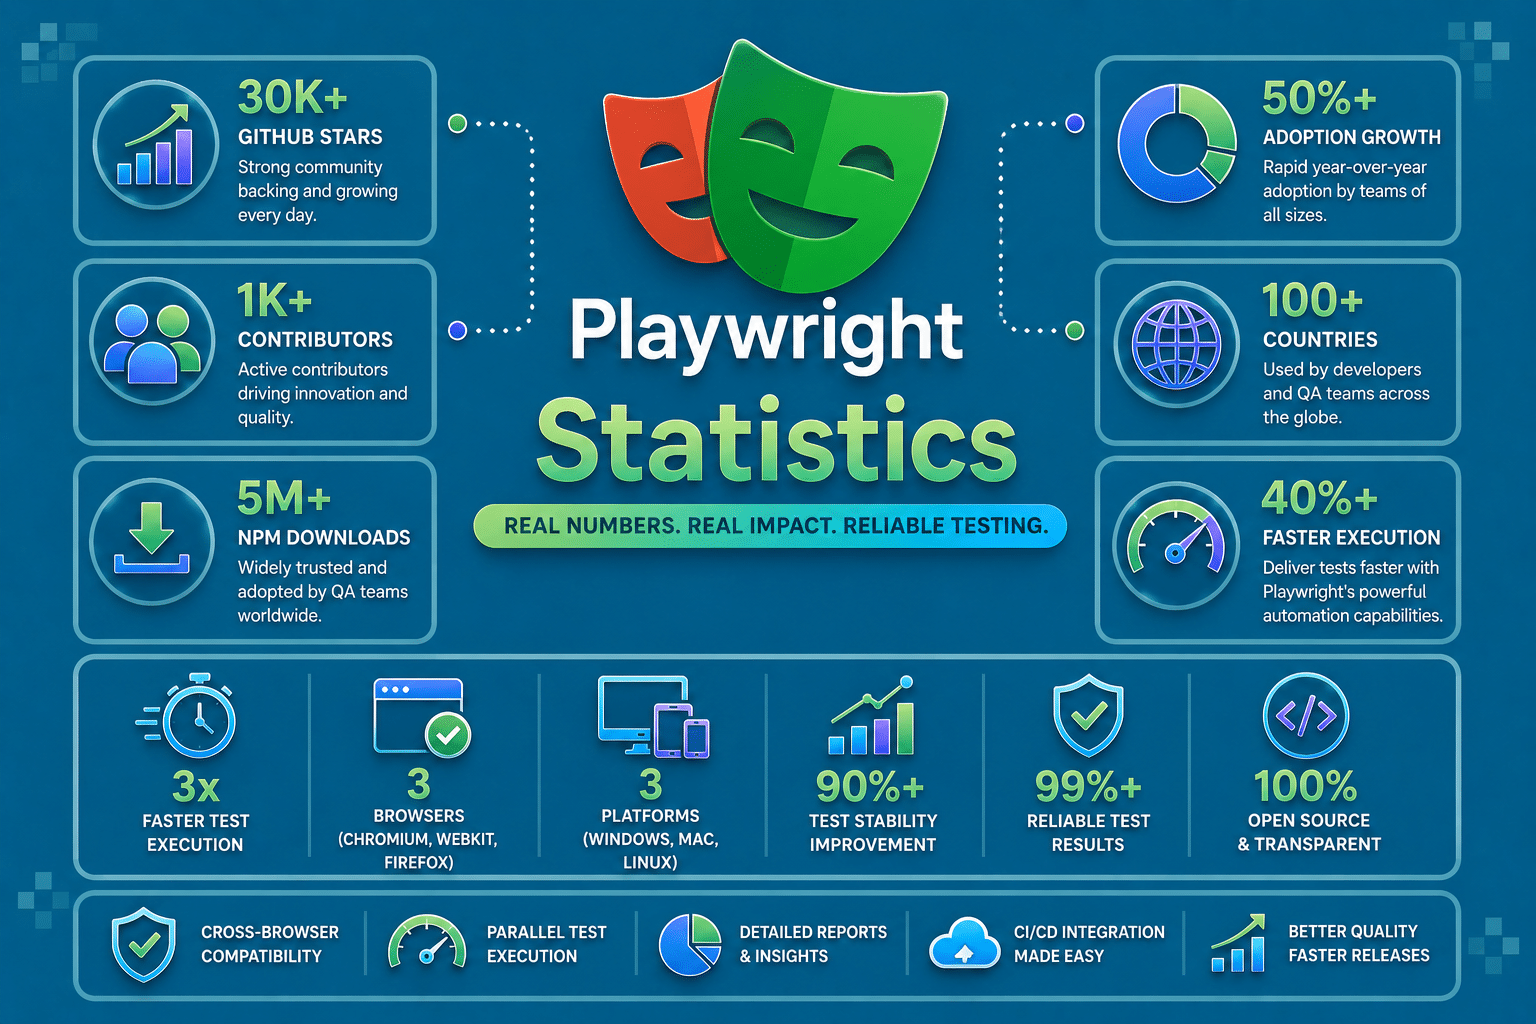

Playwright has rapidly become one of the most widely adopted browser automation frameworks, replacing older tools like Selenium and Cypress for many modern development teams.
Since its launch by Microsoft in 2020, the framework has seen explosive growth in GitHub activity, npm downloads, enterprise adoption, and developer sentiment.
This report compiles the Playwright statistics covering GitHub growth, downloads, adoption, market share, enterprise usage, developer trends, and the future of browser automation.
Playwright Statistics 2026: Key Insights & Takeaway
- Playwright’s GitHub repository has surpassed 91,000 stars, with approximately 5,900 forks and nearly 590 watchers, making it one of the most popular browser automation frameworks on GitHub.
- The playwright npm package now receives over 58.9 million weekly downloads, nearly doubling its download volume from early 2026 and highlighting continued adoption across development and CI/CD workflows.
- According to the State of JS 2024 survey, 3,674 developers reported using Playwright at work, narrowly surpassing Cypress (3,603 respondents) and making Playwright the most-used dedicated browser automation framework among surveyed JavaScript developers.
- Playwright officially overtook Cypress in weekly npm downloads during 2024, marking a significant shift in the browser automation ecosystem and reflecting growing developer preference for Playwright.
- Playwright supports Chromium, Firefox, and WebKit through a single API and provides official SDKs for TypeScript/JavaScript, Python, Java, and .NET, enabling true cross-browser and cross-language automation.
- Microsoft continues to actively maintain Playwright with a rapid release cadence. The project is now on version 1.61.1, with frequent feature releases, browser updates, and bug fixes.
- GitHub’s language breakdown shows that approximately 91% of the Playwright codebase is written in TypeScript, underscoring its strong alignment with the modern JavaScript ecosystem.
- Microsoft’s Azure Playwright Testing service supports running tests across up to 50 parallel browser instances, reflecting Playwright’s growing adoption for enterprise-scale test automation.
- Playwright’s ecosystem has expanded well beyond end-to-end testing. The official project now positions Playwright for browser testing, automation, scripting, CLI workflows, and AI agent development, broadening its use cases beyond traditional QA.
Playwright Statistics 2026: At a Glance
| Metric | Figure |
|---|---|
| Initial release | January 2020 |
| Official maintainer | Microsoft |
| Latest stable version | v1.61.1 |
| GitHub stars | 92.9K+ |
| GitHub forks | 6.1K+ |
| GitHub contributors | 480+ |
| GitHub releases | 163 |
| Primary repository language | TypeScript (~91%) |
Weekly npm downloads (playwright) | 58.9M+ |
Weekly npm downloads (@playwright/test) | 46.6M+ (npm) |
| Developers using Playwright at work (State of JS 2024) | 3,674 |
| State of JS 2023 retention | 95% |
| Browser engines supported | 3 (Chromium, Firefox, WebKit) |
| Browser targets available | 7 (Chromium, Firefox, WebKit, Chrome, Edge, Mobile Chrome, Mobile Safari) |
| Supported programming languages | 4 (JavaScript/TypeScript, Python, Java, .NET) |
| Azure Playwright Testing parallel browsers | Up to 50 |
| Official release cadence | Frequent feature releases with regular browser updates (Playwright) |
| Official release notes | Published for every stable release on Playwright Docs (Playwright) |
Playwright Statistics 2026: A Deep Dive
1.Playwright Statistics 2026: User Statistics
Playwright’s adoption has accelerated rapidly over the past five years. Weekly npm downloads have increased from fewer than one million in 2021 to nearly 60 million today, while State of JS surveys consistently rank it among the most-used browser automation frameworks.
Together, these indicators suggest that Playwright has moved beyond early adopters into mainstream software engineering organizations.
Playwright’s growth is unmistakable: a 2026 npm Trends-based estimate puts it at 33M+ weekly downloads, while Checkly noted that it had already overtaken Cypress in downloads by mid-2024.
The survey data points in the same direction. State of JS 2024 shows Playwright used at work by 3,674 respondents, only 71 ahead of Cypress but well ahead of Puppeteer at 1,865 and Selenium at 1,130.
That makes Playwright the most visible dedicated browser-automation tool in the survey’s professional-use ranking.
| Year / signal | Figure | What it suggests |
| 2021 weekly downloads | Under 1M | Early-stage adoption |
| Mid-2024 download crossover | Surpassed Cypress | Category inflection point |
| 2024 work usage | 3,674 respondents | Strong professional penetration |
| 2026 weekly downloads | 33M+ estimated | Large-scale package demand |
2. Playwright Statistics 2026: Usage & Adoption Statistics
The official documentation is explicit about Playwright’s scope: it is built for testing, scripting, and AI agents, not just classic E2E automation. The homepage says one API drives Chromium, Firefox, and WebKit, and the language matrix covers TypeScript, Python, .NET, and Java.
That breadth helps explain why Playwright has become a default option for modern web teams. The docs also show a browser matrix that can cover 7 project targets out of the box-style configuration: Chromium, Firefox, WebKit, Mobile Chrome, Mobile Safari, Google Chrome, and Microsoft Edge.
On top of that, each test gets a fresh browser context, which is one reason the framework is commonly used for isolated, parallelized CI runs.
| Usage signal | Numeric detail |
| Browser engines | 3 |
| Languages | 4 |
| Browser targets shown in docs | 7 |
| Fresh browser context per test | 1 context per test |
| Cloud parallel browsers | Up to 50 |
The adoption pattern is not only broad but also sticky. In State of JS 2023, Playwright recorded 49.94% mostly positive opinions and a 94.02 velocity score, which the survey uses to capture changes in usage and sentiment over time.
In the same survey cycle, Playwright’s retention landed at 95%, placing it among the strongest tools in the testing category.
Playwright Company Adoption & Industry Statistics
Public developer surveys show that adoption of Playwright has become widespread across professional engineering organizations.
The State of JS 2024 survey reported that 3,674 developers use Playwright at work, narrowly surpassing Cypress (3,603), while significantly exceeding Puppeteer (1,865) and Selenium (1,130).
This makes Playwright the most-used dedicated browser automation framework among respondents working in JavaScript development.
The framework’s popularity among professional teams is also reflected in Microsoft’s Azure Playwright Testing service, which is designed for enterprise-scale testing and supports execution across up to 50 parallel browser instances.
This enterprise offering demonstrates Microsoft’s continued investment in organizations running large browser automation suites.
Rather than being concentrated in a single industry, Playwright is commonly used across the following because it supports Chromium, Firefox, and WebKit through a single automation API.
- SaaS companies
- e-commerce platforms
- financial services
- healthcare pplications
- developer tooling companies
- enterprises building modern web applications
3. Playwright Statistics 2026: Enterprise Adoption Statistics
Playwright’s 3,674 professional users in 2024 put it within 71 respondents of Cypress and above all other listed E2E/browser automation tools in that survey slice. In practical terms, that suggests Playwright has crossed from enthusiast adoption into routine professional use.
Microsoft’s own cloud offering reinforces that enterprise angle. Azure Playwright Testing advertises parallel execution on up to 50 browsers, which is the kind of scale teams usually care about when browser coverage moves from a handful of tests to large CI suites.
The GitHub repo also shows 161 releases, which points to an active release cadence that enterprise teams typically watch closely before standardizing on a framework.
| Enterprise signal | Figure |
| Professional users in State of JS 2024 | 3,674 |
| Gap to Cypress in work usage | 71 respondents |
| Azure cloud parallelism | Up to 50 browsers |
| Repository releases | 161 |
| Latest release date | May 11, 2026 |
4. Playwright Statistics 2026: Market Share & Competitive Statistics
By the public metrics that developers tend to quote, Playwright is now ahead of the two most common comparison points in browser automation. Its repository has 89.8k stars, versus 49.7k for Cypress and 34.1k for SeleniumHQ/selenium.
In npm Trends-style estimates, Playwright is at 33M+ weekly downloads, while Cypress sits around 6.5M and selenium-webdriver around 2.1M.
The opinion data points the same way. State of JS 2023 shows Playwright at 49.94% mostly positive opinions, Cypress at 29%, and Selenium at -34.29%.
That is not a perfect apples-to-apples market-share measure, but it is one of the clearest public signals that Playwright’s developer mindshare is stronger than the older incumbents.
| Metric | Playwright | Cypress | Selenium |
| GitHub stars | 89.8k | 49.7k | 34.1k |
| Weekly npm downloads | 33M+ est. | 6.5M est. | 2.1M est. for selenium-webdriver |
| Used at work (State of JS 2024) | 3,674 | 3,603 | 1,130 |
| Mostly positive opinions (State of JS 2023) | 49.94% | 29% | -34.29% |
For readers comparing tools, the most important number in that table is the download gap. Playwright’s estimated 33M+ weekly downloads are about 5.1x Cypress’s 6.5M and about 15.7x selenium-webdriver’s 2.1M.
5. Playwright Statistics 2026: Developer / API / Platform Statistics
Playwright is still fundamentally a TypeScript-led project. GitHub lists the codebase as 91.2% TypeScript, with smaller shares for HTML at 3.9%, CSS at 2.4%, C++ at 0.8%, Objective-C at 0.5%, and JavaScript at 0.5%.
That language mix is a strong sign that Playwright remains tightly coupled to the JavaScript ecosystem even as it expands into other runtimes.
The project is also unusually broad for a browser automation library. The official site says Playwright is available for 4 languages, and the homepage now groups the product into testing, CLI, MCP, and library paths.
Playwright also maintains one of the most active release cadences among browser automation frameworks.
Regular releases ensure compatibility with the latest Chromium, Firefox, and WebKit browser versions while introducing new testing capabilities for modern web applications.
That matters because browser automation is no longer just about test execution; Playwright is being used as a platform for agentic workflows as well.
| Platform metric | Figure |
| TypeScript share in repo | 91.2% |
| HTML share | 3.9% |
| CSS share | 2.4% |
| C++ share | 0.8% |
| JavaScript share | 0.5% |
| Languages supported | 4 |
| Releases | 161 |
| Watchers | 577 |
Playwright Release History & Latest Version Statistics
Playwright was first released by Microsoft in January 2020 and has maintained a rapid monthly release cadence ever since.
Frequent releases allow the project to ship browser updates, new automation capabilities, bug fixes, and developer tooling improvements on a predictable schedule.
As of this report, the latest stable Playwright release is v1.61.1.
The project continues to receive regular updates through GitHub Releases and the official Playwright release notes, demonstrating active maintenance by Microsoft’s engineering team.
Some of the notable capabilities introduced in recent releases include:
- Passkey (WebAuthn) testing support
- Continued browser engine updates
- Improvements to browser automation APIs
- Expanded tooling for AI agent workflows
- Ongoing Chromium, Firefox, and WebKit compatibility updates
Microsoft typically publishes detailed release notes for every Playwright version, making it easy for development teams to track new features and breaking changes before upgrading.
6. Playwright Statistics 2026: Regional & Geographic Statistics
North America accounted for 35.3% of global software testing revenue in 2025, while Fortune Business Insights says Asia Pacific held 34.78% of the automation testing market in 2025.
That is an inference, not a Playwright-specific census, but it still matters: the largest testing-spend regions are also the places where Playwright’s enterprise adoption is most likely to be strongest.
In other words, Playwright’s growth is happening inside a market that is already concentrated in high-spend geographies.
| Region | Market share figure |
| North America | 35.3% of software testing revenue in 2025 |
| Asia Pacific | 34.78% of automation testing market in 2025 |
7. Playwright Statistics 2026: Market Trends & Industry Growth Statistics
The broader automation-testing market is still expanding quickly. Fortune Business Insights estimates the market at $20.60 billion in 2025, rising to $84.22 billion by 2034 at a 16.84% CAGR.
Grand View Research gives a broader software-testing market estimate of $49.36 billion in 2025 and $93.15 billion by 2033, with an 8.5% CAGR.
For Playwright, the implication is straightforward: the category it sits in still has room to compound. When a tool already has 33M+ weekly downloads, 89.8k stars, and 3,674 work users, a rising market does not just add traffic; it expands the number of teams that can standardize on the tool.
That is why Playwright’s current numbers matter beyond the framework itself.
| Market metric | Figure |
| Automation testing market size, 2025 | $20.60B |
| Automation testing market size, 2034 | $84.22B |
| Automation testing CAGR | 16.84% |
| Software testing market size, 2025 | $49.36B |
| Software testing market size, 2033 | $93.15B |
| Software testing CAGR | 8.5% |
Conclusion
Playwright ends 2026 with a clear public footprint: 89.8k GitHub stars, 33M+ weekly npm downloads estimated from npm Trends, and 3,674 State of JS 2024 work users.
Its 95% retention in State of JS 2023 and 161 releases through v1.60.0 show that the project is still moving quickly, not just riding old momentum.
The broader market is still expanding too, with automation testing forecast to grow from $20.60 billion in 2025 to $84.22 billion by 2034.
That makes Playwright look less like a niche successor to older test frameworks and more like one of the main standards shaping modern browser automation.
FAQ’s
Q: How many users does Playwright have?
A: Playwright does not publish an official monthly active user figure. The strongest public adoption signals are 33M+ weekly npm downloads in early 2026 and 3,674 developers in the State of JS 2024 survey reporting that they use Playwright at work.
Q: Is Playwright more popular than Cypress?
A: By most public ecosystem metrics, yes. Playwright has approximately 89.8K GitHub stars compared with Cypress’s 49.7K, and its estimated weekly npm downloads exceed 33M+ versus roughly 6.5M for Cypress.
Q: What are Playwright’s main use cases?
A: Playwright is widely used for end-to-end testing, browser automation, web scraping, scripting, and AI-powered browser workflows. It supports all major browser engines and multiple programming languages, making it a popular choice for both QA automation and developer tooling.
Q: How fast is Playwright growing?
A: Playwright has grown from fewer than 1 million weekly npm downloads in 2021 to more than 33 million by early 2026. Industry tracking also showed it overtaking Cypress in download volume during 2024.
Q: When was Playwright released?
A: Microsoft officially released Playwright in January 2020. Since then, the framework has maintained a frequent release cadence with regular browser updates, new features, performance improvements, and bug fixes.
Q: What is the latest Playwright version?
A: At the time of writing, the latest stable Playwright release is v1.61.1. Microsoft publishes detailed release notes covering new features, browser updates, bug fixes, and breaking changes for every release.
Q: Where can I find Playwright release notes?
A: Playwright release notes are available through the official Playwright documentation and GitHub Releases page. They include migration guidance, browser version updates, API additions, and known issues.
Q: What is Playwright’s retention rate?
A: In the State of JS 2023 survey, Playwright recorded a 95% retention rate, making it one of the highest-retained testing frameworks in the JavaScript ecosystem. The same survey also reported overwhelmingly positive developer sentiment.
Q: Who uses Playwright most?
A: Playwright is most widely used by professional software engineering teams building modern web applications. In the State of JS 2024 survey, 3,674 developers reported using Playwright at work, making it one of the leading browser automation frameworks in production environments.