

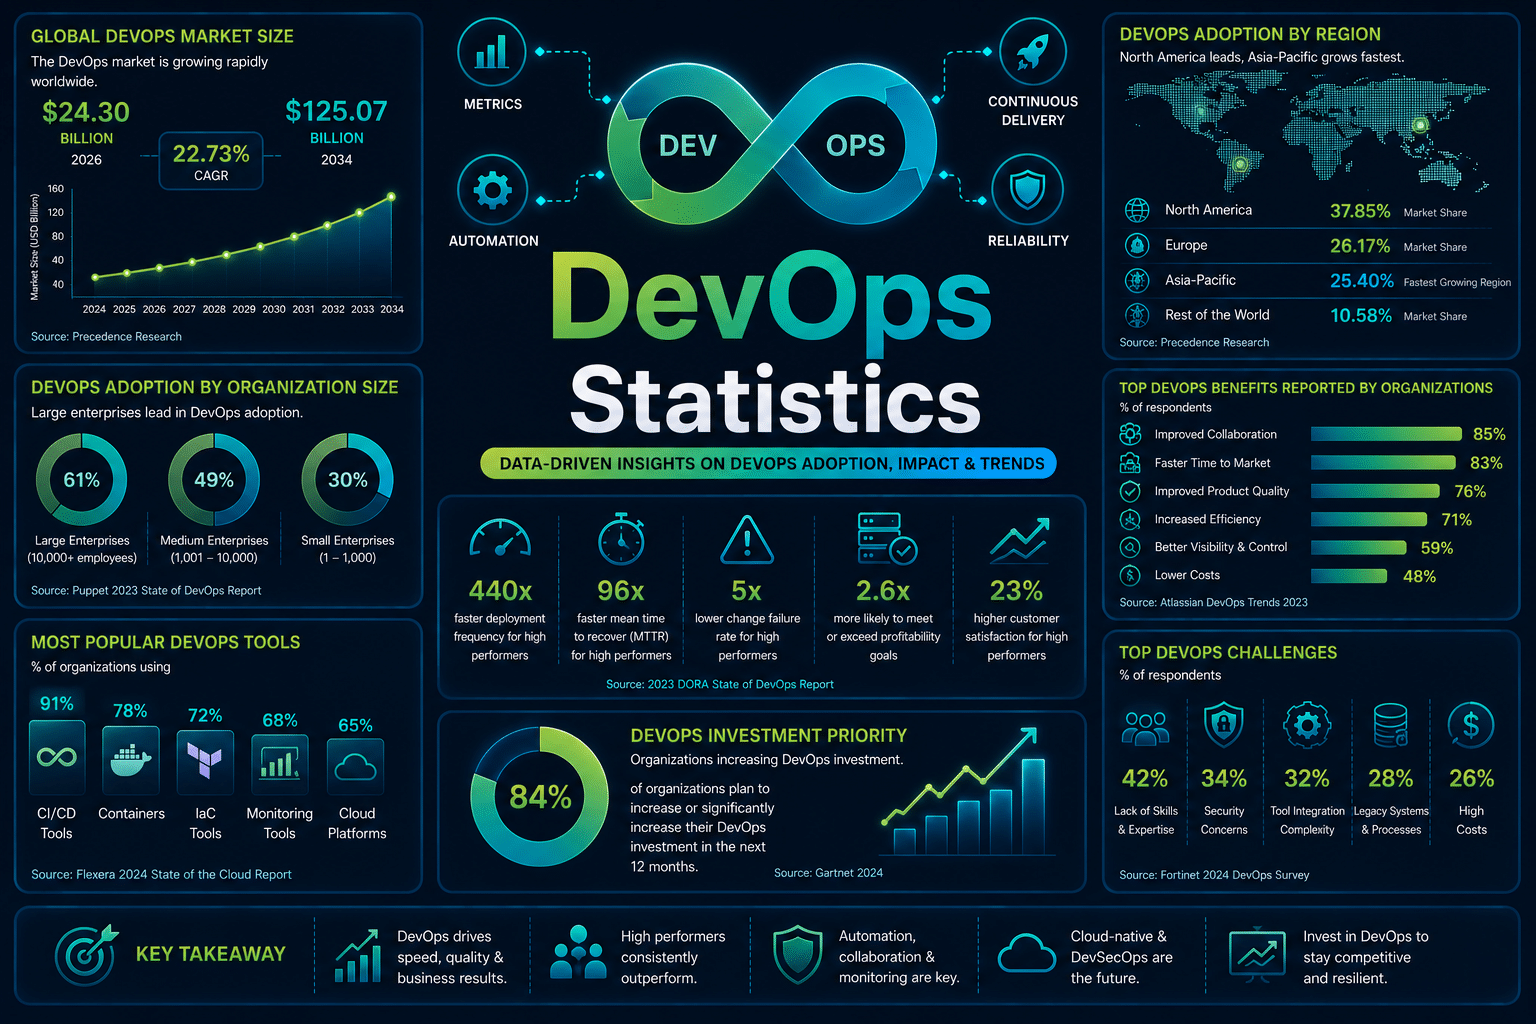

The global DevOps market is worth $24.30 billion in 2026 and is projected to reach $125.07 billion by 2034, a 22.73% compound annual growth rate.
Elite-performing DevOps teams now deploy 182 times more often than low performers, with 8 times lower change failure rates and recovery times that are 2,293 times faster.
DevOps has moved from a cultural buzzword to a measurable, heavily benchmarked discipline.
Every major metric in this space, deployment frequency, lead time, change failure rate, container adoption, and CI/CD tool usage, now has years of survey data behind it, and the gap between the best and worst-performing teams keeps widening rather than closing.
This article breaks down DevOps statistics for 2026: market size and regional distribution, DORA performance benchmarks, CI/CD tool adoption, container and GitOps trends, and where testing and quality assurance fit inside the modern DevOps pipeline.
Key DevOps Statistics: Takeaways
- The global DevOps market is valued at $24.30 billion in 2026, projected to reach $125.07 billion by 2034 at a 22.73% CAGR.
- North America holds 37.85% of the global DevOps market, while Asia-Pacific is growing fastest at a 25.4% CAGR through 2031.
- 19% of teams now qualify as “elite” DevOps performers, with 22% “high,” 35% “medium,” and 25% “low” performers.
- Elite performers deploy 182 times more often, recover 2,293 times faster, and have 8 times lower change failure rates than low performers.
- 82% of container users now run Kubernetes in production, up from 80% in 2024 and 66% in 2023.
- 98% of organizations have adopted cloud-native techniques in some form.
- GitHub Actions leads CI/CD tool adoption at 33%, followed by Jenkins at 28% and GitLab CI at 19%.
- 55% of developers regularly use CI/CD tools, while 18% report using none at all.
- 58% of “cloud native innovator” organizations use GitOps extensively, compared to just 23% of standard adopters.
- AI adoption among developers reached 90% in 2025, up from 76% in 2024, but continues to show a negative relationship with delivery stability.
- Teams that integrate QA earlier in the DevOps pipeline (shift-left testing) report 40% fewer post-release bugs.
DevOps Statistics at a Glance
| Metric | Figure |
|---|---|
| Global DevOps market (2026) | $24.30 billion |
| Global DevOps market (2034 projection) | $125.07 billion |
| DevOps market CAGR | 22.73% |
| North America share of DevOps market | 37.85% |
| Elite DevOps performers (share of teams) | 19% |
| Elite vs. low performer deployment frequency | 182x more often |
| Elite vs. low performer recovery speed | 2,293x faster |
| Kubernetes production adoption (container users) | 82% |
| Organizations with cloud-native adoption | 98% |
| Top CI/CD tool by adoption | GitHub Actions (33%) |
| Developers engaging in CI/CD tools | 55% |
| Developer AI adoption (2025) | 90% |
| Software testing market (2026 → 2031) | $54.44B → $99.94B |
Devops Statistics: A Deep Dive
1. DevOps Statistics: Market Size and Regional Growth
The DevOps market has moved well past early-adopter territory and into sustained, high-growth infrastructure spending, with clear regional and organizational patterns emerging.
| Market segment | 2026 value | Future projection | CAGR |
|---|---|---|---|
| Global DevOps market | $24.30 billion | $125.07 billion (2034) | 22.73% |
| CI/CD tools market | $13.2 billion | $22.9 billion (2033) | 8.2% |
| Software testing market | $54.44 billion | $99.94 billion (2031) | 12.92% |
| Automation testing market | $36.79 billion (2025) | $172.36 billion (2035) | 16.7% |
| AI test automation market | $8.81 billion (2025) | $35.96 billion (2032) | 22.3% |
| Segment breakdown | Share or figure |
|---|---|
| North America share of DevOps market (2025) | 37.85% |
| Asia-Pacific DevOps market growth rate (2026–2031) | 25.4% CAGR |
| Large enterprise share of DevOps revenue (2025) | 64.05% |
| SME DevOps market growth rate (2026–2031) | 21.2% CAGR |
| IT and telecommunications share of DevOps market (2025) | 25.05% |
| Healthcare and life sciences DevOps growth rate (2026–2031) | 28.1% CAGR |
Large enterprises still account for nearly two-thirds of DevOps spending.
However, the fastest growth is coming from smaller organizations and traditionally slower-moving industries like healthcare, which are now catching up to the automation levels that software-native companies established years ago.
2. DevOps Statistics: DORA Metrics and Delivery Performance
The DORA (DevOps Research and Assessment) program remains the most rigorously benchmarked source for software delivery performance, built on data from thousands of engineering teams.
| Performance tier | Share of teams | Deployment frequency | Lead time | Change failure rate | Recovery time |
|---|---|---|---|---|---|
| Elite | 19% | On demand (multiple times/day) | Under 1 day | ~5% | Under 1 hour |
| High | 22% | Weekly to monthly | 1 day to 1 week | Varies (2024 data showed an unusual inversion vs. medium tier) | Under 1 day |
| Medium | 35% | Weekly to monthly | 1 week to 1 month | Lower than the high tier in 2024’s data | 1 day to 1 week |
| Low | 25% | Monthly to every 6 months | 1 to 6 months | 46–60% | 1 week to 1 month |
The distance between tiers is the real story. Compared to low performers, elite teams deploy 182 times more frequently, ship changes 127 times faster, fail 8 times less often, and recover from incidents 2,293 times faster.
That gap has been widening across recent survey years, suggesting DevOps maturity compounds for the teams that invest in it rather than converging across the industry.
The 2025 DORA research shows that AI has become nearly universal across software engineering teams, with 90% of technology professionals now using AI at work.
More than 80% report higher productivity, while 59% say AI has improved code quality.
However, researchers also found that higher AI adoption is still associated with lower software delivery stability, suggesting that organizations without mature engineering practices often generate code faster than they can safely review, test, and deploy.
Rather than replacing DevOps best practices, AI appears to amplify the strengths and weaknesses already present within engineering organizations.
3. DevOps Statistics: Containers and Cloud-Native Adoption
Container orchestration has moved from emerging technology to near-universal infrastructure standard, according to the most recent industry-wide cloud-native survey.
| Metric | Figure |
|---|---|
| Container users running Kubernetes in production (2025) | 82% |
| Same figure in 2024 | 80% |
| Same figure in 2023 | 66% |
| Organizations reporting some cloud-native adoption | 98% |
| Organizations where most/nearly all development is cloud-native | 59% |
| Organizations using Kubernetes for generative AI inference workloads | 66% |
| Organizations not yet running AI/ML workloads on Kubernetes | 44% |
Production Kubernetes adoption has climbed every year for the past three years running, and for the first time, the primary barrier to further adoption is cultural rather than technical.
47% of organizations cite cultural change within development teams as their top challenge, ahead of lack of training (36%), security concerns (36%), and technical complexity (34%).
That marks a reversal from prior years, when technical complexity consistently ranked as the top blocker.
4. DevOps Statistics: GitOps and Platform Engineering
GitOps and internal developer platforms have emerged as the clearest marker separating DevOps-mature organizations from the rest of the industry.
Internal developer platforms are rapidly becoming standard infrastructure for modern DevOps organizations.
Google’s 2025 DORA research found that 90% of organizations have adopted at least one internal developer platform, while 76% now maintain dedicated platform engineering teams.
The report concludes that platform quality has become one of the strongest predictors of whether organizations successfully convert AI-assisted development into measurable improvements in software delivery.
Check out our full, detailed report on the impact of AI coding statistics →
| Metric | Figure |
|---|---|
| “Cloud native innovator” organizations using GitOps extensively | 58% |
| Standard “adopter” organizations using GitOps extensively | 23% |
| Kubernetes clusters using Argo CD for GitOps delivery | Nearly 60% |
| Argo CD Net Promoter Score | 79 |
| Organizations with at least one internal developer platform | 90% |
The gap between “innovator” and “adopter” organizations on GitOps usage (58% versus 23%) is one of the clearest maturity signals in the entire DevOps data landscape.
Teams that standardize on Git as the single source of truth for both application and infrastructure configuration consistently show up in the higher DORA performance tiers.
5. DevOps Statistics: CI/CD Adoption and Tooling
Continuous integration and continuous delivery have become close to universal among professional engineering teams, with a small number of tools dominating adoption.
| CI/CD tool | Organizational adoption |
|---|---|
| GitHub Actions | 33% |
| Jenkins | 28% |
| GitLab CI | 19% |
GitHub Actions’ lead tracks closely with GitHub’s overall developer footprint, which Panto AI’s own GitHub statistics research puts at over 180 million developers.
GitLab CI’s 19% adoption share sits alongside GitLab’s broader platform growth, covered in Panto AI’s GitLab statistics research, while Bitbucket Pipelines serves a smaller but enterprise-heavy base detailed in the Bitbucket statistics research.
Beyond the top three, 83% of developers report engaging in some form of DevOps activity, 55% regularly use CI/CD tools specifically, and 18% report using no CI/CD tool at all, a reminder that “near-universal” adoption still leaves a meaningful minority of teams without formal pipelines.
Tool adoption alone no longer predicts DevOps success.
Google’s latest DORA research emphasizes that developer experience, platform quality, and user-centric engineering practices increasingly determine whether investments in CI/CD and AI translate into faster, more reliable software delivery.
Organizations with strong internal platforms are significantly better positioned to scale AI-assisted development without sacrificing stability.
6. DevOps Statistics: Testing and Quality in the DevOps Pipeline
Quality assurance has shifted from a release-gate function to something embedded across the entire DevOps pipeline, and the numbers reflect that shift.
- Teams that integrate QA earlier in the development cycle (shift-left testing) report 40% fewer post-release bugs.
- The automation testing market is projected to grow more than 4.5x, from $36.79 billion in 2025 to $172.36 billion by 2035.
- The AI-specific test automation segment is growing even faster, from $8.81 billion in 2025 to a projected $35.96 billion by 2032.
- Mobile-specific testing, detailed in Panto AI’s mobile app testing statistics research, is being pulled into the same DevOps pipelines, with North America holding roughly 37% of mobile app testing services revenue, driven largely by DevOps-embedded compliance testing in banking and healthcare.
As AI-generated code increases deployment volume, automated testing has become even more important.
The 2025 DORA report found that AI adoption improves developer throughput, but organizations with weaker testing and review processes experience lower delivery stability, reinforcing the role of continuous testing in modern DevOps pipelines.
This is the layer where DORA’s stability metrics and testing maturity intersect directly.
A team cannot sustain elite-tier deployment frequency without automated, pipeline-embedded quality checks absorbing the regression risk that comes with shipping faster.
Platforms like Panto AI’s automation testing tools and no-code test automation tools are built specifically to sit inside that pipeline layer, running natural-language mobile tests on every build rather than as a separate manual gate.
7. DevOps Statistics: AI’s Impact on Delivery
AI tooling is now deeply embedded in DevOps workflows, though the data shows a genuine tradeoff between speed and stability rather than a clean win.
- AI adoption among developers reached 90% in 2025, up from 76% in 2024.
- Over 80% of respondents reported increased productivity from AI tools, and 59% reported an increase in code quality.
- AI adoption continues to show a negative relationship with software delivery stability, even as its relationship with throughput turned positive for the first time in 2025.
- 90% of organizations have adopted at least one internal developer platform, which researchers link directly to how well teams convert AI adoption into real gains rather than added instability.
The research also found that software professionals typically spend a median of two hours each day working with AI tools.
While AI has become embedded across coding, documentation, testing, and debugging workflows, organizations continue to report that engineering culture and platform maturity have a greater influence on delivery outcomes than AI adoption alone.
The pattern is consistent with what Panto AI’s own AI coding productivity statistics research found: AI accelerates code generation, but the teams that benefit most are the ones with strong automated testing and review infrastructure already in place to absorb that increased volume.
8. DevOps Statistics: Market Outlook
The trajectory across every dataset points toward the same conclusion.
DevOps spending is consolidating around automation, AI-augmented testing, cloud-native infrastructure, and quality tooling rather than raw pipeline software alone.
With the DevOps market projected to grow at a 22.73% CAGR through 2034, Asia-Pacific expanding at 25.4% CAGR, and AI test automation growing even faster at 22.3% CAGR, the fastest-growing dollars in this space are going toward the systems that keep deployment velocity from outrunning software quality.
That is precisely the tension DORA’s own data captures: throughput and stability move together for elite performers.
However, AI-driven increases in code volume are testing whether QA infrastructure can keep pace across the rest of the industry, particularly as cultural readiness, not technical capability, becomes the dominant adoption barrier.
Conclusion
DevOps performance in 2026 is defined by a widening gap rather than industry-wide convergence.
Elite teams now make up just 19% of organizations, yet they deploy 182 times more frequently and recover from failures 2,293 times faster than low-performing teams.
Their advantage continues to grow as DevOps maturity compounds over time.
At the same time, the global DevOps market is projected to reach $125.07 billion by 2034, with investment increasingly flowing toward cloud-native infrastructure, GitOps, platform engineering, and AI-powered testing.
The focus has shifted from adopting more tools to building engineering systems that improve both developer productivity and software reliability.
The data also shows that speed alone is not enough. Organizations achieving the best outcomes combine rapid delivery with embedded quality practices, using continuous testing and automated validation throughout the deployment pipeline.
As AI accelerates software development, these practices are becoming essential for maintaining stability while shipping faster.
FAQs
Q: How big is the global DevOps market in 2026?
A: The global DevOps market is valued at $24.30 billion in 2026 and is projected to reach $125.07 billion by 2034, growing at a 22.73% CAGR. The rapid expansion reflects continued enterprise investment in cloud-native development, automation, and AI-powered software delivery.
Q: Which region leads DevOps adoption?
A: North America leads the global DevOps market with a 37.85% share. Meanwhile, Asia-Pacific is the fastest-growing region, forecast to expand at a 25.4% CAGR through 2031 as cloud adoption and digital transformation accelerate.
Q: What percentage of teams are considered elite DevOps performers?
A: Around 19% of engineering teams qualify as elite DevOps performers. These teams deploy on demand, achieve lead times of less than one day, and maintain change failure rates of roughly 5%.
Q: How widely is Kubernetes used in production?
A: Kubernetes has become the production standard for container orchestration. 82% of organizations using containers now run Kubernetes in production, while 98% report adopting cloud-native technologies in some form.
Q: What is the most widely adopted CI/CD tool?
A: GitHub Actions leads CI/CD adoption with 33% organizational usage, followed by Jenkins (28%) and GitLab CI (19%). Together, these platforms power a large share of modern software delivery pipelines.
Q: How much faster are elite DevOps teams than low performers?
A: According to DORA research, elite teams deploy 182× more frequently, recover from incidents 2,293× faster, and experience 8× lower change failure rates than low-performing teams.
Q: Does AI improve DevOps performance?
A: Yes, but with caveats. AI adoption reached 90% among developers in 2025 and has improved coding productivity and delivery speed. However, Google’s DORA research found that without mature engineering practices, AI can negatively impact software delivery stability.
Q: How much does shift-left testing reduce bugs?
A: Teams that integrate testing earlier in the development lifecycle report approximately 40% fewer post-release defects. Catching issues before deployment reduces rework, lowers costs, and improves release quality.
Q: Does AI replace DevOps?
A: No. AI enhances DevOps by automating repetitive tasks, accelerating code reviews, and improving developer productivity, but it does not replace proven DevOps practices. Google’s DORA research concludes that organizations with mature engineering processes benefit the most from AI adoption.
Q: Why is platform engineering becoming important in DevOps?
A: Platform engineering helps standardize infrastructure, deployment workflows, and developer self-service. According to Google’s latest DORA research, 90% of organizations now use at least one internal developer platform, making platform engineering a key driver of faster and more reliable software delivery.