

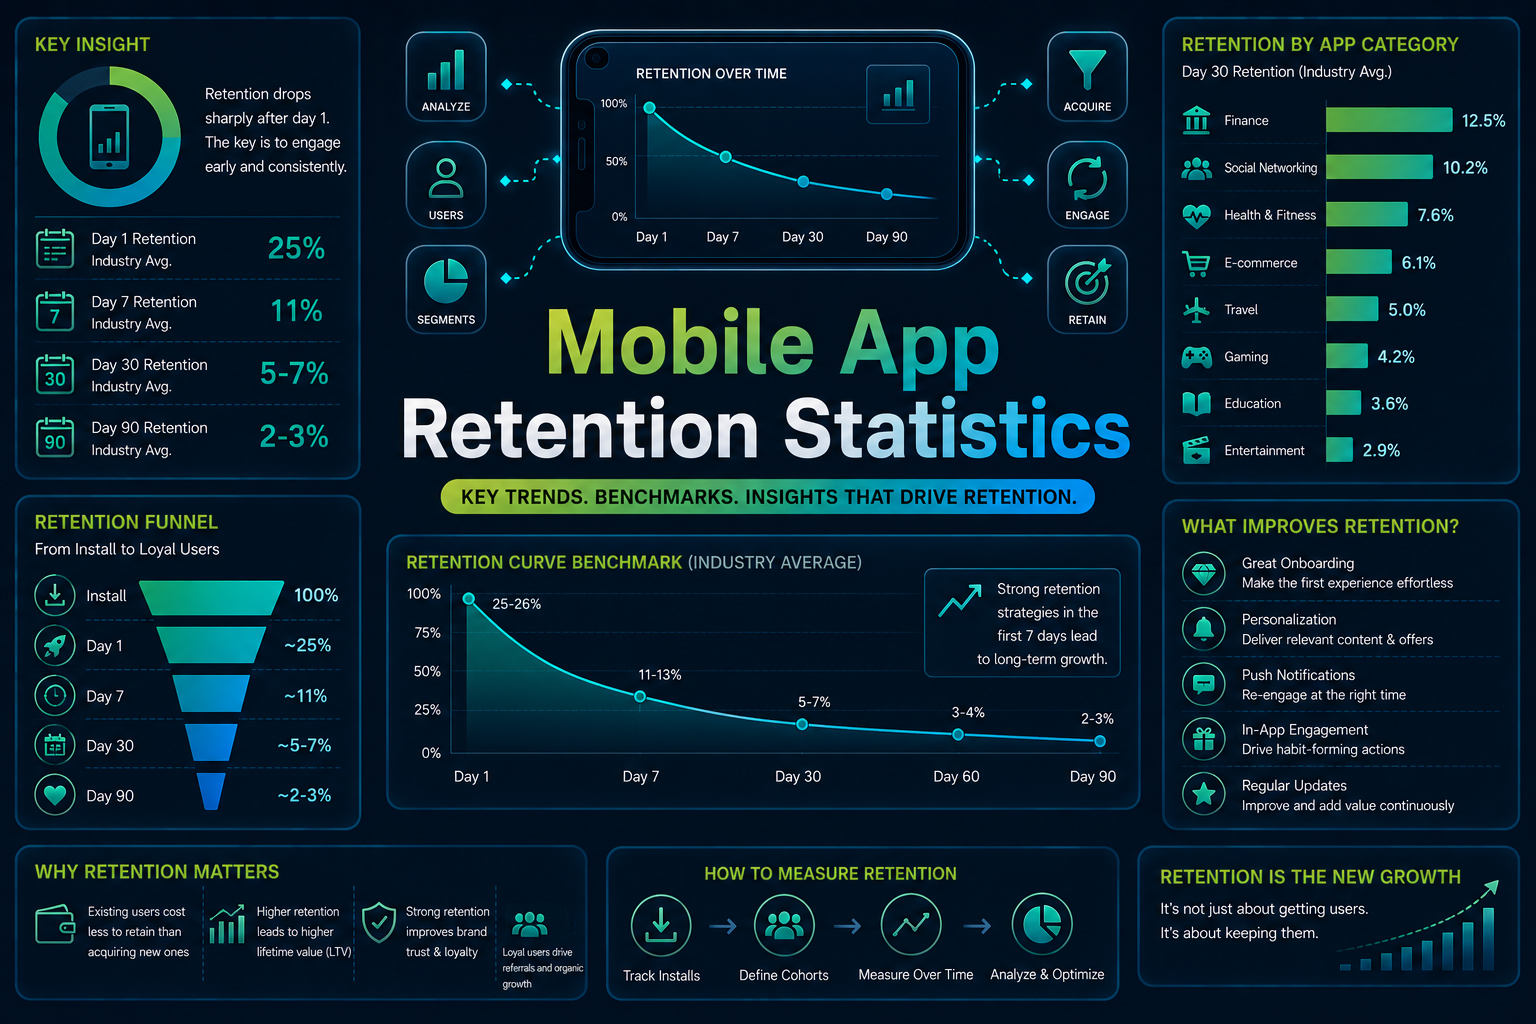

More than 90% of mobile app users abandon an app before day 30, and even wildly popular mobile games see churn above 80%.
On iOS, day-one retention averages 25.4%, dropping to just 5.3% by day 30. Android trails at 20.2% day one and 3.8% day 30.
A typical mobile app loses roughly 75% of its users within the first three days of install, before most product teams have even finished analyzing the cohort.
Retention has become the defining health metric for mobile products. Downloads are cheap to buy and easy to inflate, but retention reflects whether an app actually delivers value after the install screen disappears.
As acquisition costs climb and app store growth flattens, product teams are judged less on how many users they bring in and more on how many they keep, a pattern that shows up clearly in Panto AI’s mobile app usage data as well.
This mobile app retention statistics article breaks down mobile app retention statistics for 2026, using global benchmarks, platform differences, vertical data, subscription retention and why users actually leave.
Key Mobile App Retention Statistics: Takeaways
- iOS day-one retention averages 25.4%, falling to 5.3% by day 30.
- Android day-one retention averages 20.2%, falling to 3.8% by day 30.
- More than 90% of users give up on an app before the 30-day mark.
- Subscription apps retain 14% of users by day 30, versus 5.4% for ad-monetized apps, a 2.6x gap.
- 95% of users who cancel an annual subscription never come back, with reactivation ranging from just 3% to 8% depending on category.
- 88% of users abandon an app after encountering bugs or glitches, and 51% stop using an app entirely if issues recur daily.
Mobile App Retention Statistics at a Glance
| Metric | Figure |
|---|---|
| Global retention — Day 1 | 26% |
| Global retention — Day 7 | 13% |
| Global retention — Day 14 | 10% |
| Global retention — Day 30 | 7% |
| iOS retention — Day 1 | 25.4% |
| iOS retention — Day 30 | 5.3% |
| Android retention — Day 1 | 20.2% |
| Android retention — Day 30 | 3.8% |
| iOS vs. Android Day-30 retention | 1.33× |
| Fintech Day-1 retention | 22% |
| Finance app Day-30 retention | 4.2% |
| Subscription app Day-30 retention | 14% |
| Ad-monetized app Day-30 retention | 5.4% |
| Average iOS CPI — Q1 2026 | $5.84 |
| Average Android CPI — Q1 2026 | $1.92 |
| Global ATT opt-in rate — 2026 | 27% |
| App Store weekly users | 850M+ |
| Google Play monthly users | 2.5B+ |
| Global app downloads — 2025 | Nearly 150B |
| Time spent in iOS & Google Play apps — 2025 | 5.3T hours |
| Mobile games IAP revenue — 2025 | ~$82B |
| Total in-app purchases + paid apps/games revenue — 2025 | $167B |
Mobile App Retention Statistics: A Deep Dive
1. Mobile App Retention Statistics: The Global Baseline
Retention is almost always measured at three checkpoints: day 1 (did onboarding work), day 7 (has a habit formed), and day 30 (is the app delivering ongoing value).
| Checkpoint | Global average |
|---|---|
| Day 1 | 26% |
| Day 7 | 13% |
| Day 14 | 10% |
| Day 30 | 7% |
According to Adjust’s global benchmark, retention falls from 26% on day 1 to 13% on day 7, 10% on day 14, and 7% by day 30.
What’s consistent across every current dataset is the shape of the curve: a typical app loses roughly 75% of its users within the first three days. The steepest drop happens in the first week, and by day 30 the overwhelming majority of installs are gone for good.
Two definitions matter when comparing any retention figures:
Classic retention measures whether a user returns on the exact day being measured (say, day 30)
Rolling retention measures whether they returned on or after that day.
2. Mobile App Retention Statistics by Platform: iOS vs Android
Platform matters more than most teams assume. Across nearly every category tracked, iOS retains users at a meaningfully higher rate than Android.
| Platform | Day 1 | Day 30 |
|---|---|---|
| iOS | 25.4% | 5.3% |
| Android | 20.2% | 3.8% |
On a day-30 aggregate basis, iOS retention runs about 1.33x higher than Android, a smaller gap than the 1.5–2x figure that still circulates in older industry commentary.
iOS outperforms Android in nearly every category, with telecommunications the one notable exception, where Android retention runs higher.
News apps show the widest platform gap, with iOS day-one retention reaching 35.88%, the highest of any tracked category on either platform.
That persistent gap is one reason engineering teams increasingly run dedicated iOS app testing automation and Android app testing automation pipelines rather than treating both platforms as interchangeable in QA planning.
3. Mobile App Retention Statistics by Category
Retention varies enormously depending on what the app actually does.
A generic cross-category average is close to meaningless without this context, and day-one retention by category shows a wide spread even before day 7 or day 30 compound the differences.
| Category | Day-1 retention |
|---|---|
| Fintech | 22% |
| Utility | 21% |
| Entertainment | 20% |
| Shopping | 18% |
| Travel | 16% |
| Food & drink | 13% |
Fintech’s relatively strong day-one number is generally attributed to the fact that setting up a new financial platform requires deliberate commitment from users, which filters out casual or accidental installs before day one even starts.
Food & drink apps sit at the opposite end, likely reflecting how many competing options consumers juggle and how quickly novelty wears off in that category.
For cross-platform teams, Flutter app testing is another relevant QA path when retention depends on consistent behavior across different mobile environments.
Fintech retention also varies sharply by region.
Day-one retention for fintech apps runs 18% in MENA, 17% in Europe, 15% in APAC, and 13% in both LATAM and North America, a spread wide enough that a single global fintech benchmark is of limited use for regional planning.
At day 30, the picture shifts.
Directional 2026 ranges across multiple providers put social and communication apps at the top of the field (roughly 15–20% day-30 retention).
This is followed by productivity and utility apps (10–18%), fintech and banking (10–15%), gaming (4–8%), and e-commerce or retail at the bottom (3–6%).
Mobile App Retention Statistics: Finance and Fintech Apps
Finance and fintech apps operate in a highly competitive environment where retention varies significantly by use case.
While some financial products become part of users’ daily routines, others are opened only when a specific transaction or financial need arises.
The available retention and conversion figures therefore provide a useful view of how effectively finance apps sustain user engagement beyond the initial download.
| Metric | Figure |
|---|---|
| Finance app day-30 retention | 4.2% |
| Finance app users completing full activation by day 30 | 14% |
| Finance app conversion rate, iOS | 32.8% |
| Finance app conversion rate, Google Play | 19.7% |
Stock trading apps report the highest average retention within the finance category, while payments apps record the lowest.
This difference highlights the importance of product use case and frequency when evaluating retention across financial apps.
A trading platform may encourage recurring engagement, whereas a payments app may be used primarily when a transaction is required.
Recent 2026 industry commentary has also pointed to a potential decline in day-30 retention across the finance vertical.
Factors cited including increasing saturation in challenger banking, tighter regulation of buy-now-pay-later products, and reduced engagement with crypto-adjacent applications.
These developments suggest that fintech retention should be evaluated by individual product category and user behavior rather than treated as a consistently strong characteristic of the broader finance sector.
Mobile App Retention Statistics: Marketplace, Shopping, and Games
| Category | Day 1 | Day 7 | Day 30 |
|---|---|---|---|
| Marketplace apps (Amazon, eBay, Poshmark-type) | 33.7% | 16.1% | 8.7% |
| General shopping apps | 24.5% | 10.7% | 4.8–5.6% |
| Mobile games (average) | ~28–30% | ~10–13% | 3–5% |
Games show meaningfully different curves depending on sub-genre.
Hyper-casual titles typically land around 33% day-1, 12% day-7, and 4% day-30, while mid-core games retain far better, at roughly 45% day-1, 22% day-7, and 10% day-30.
That gap reflects genuine differences in production depth and player investment rather than measurement noise. Two additional data points stand out for games as a whole.
Sensor Tower reports that mobile games generated approximately $82 billion in in-app purchase revenue in 2025, up 1.3% year over year, even as game downloads declined.
Mobile games lose roughly 70% of users within the first 72 hours, and marketplace app retention declined slightly across all three checkpoints between 2023 and 2024, day 1 fell from 27% to 25%, day 7 from 16% to 15%, and day 30 from 9% to 8%.
Category leaders and laggards are consistent across reports: news and magazine apps post some of the highest retention rates.
Generative AI apps and photo/video apps post the lowest. Among games specifically, RPG and sports titles retain best on iOS, while puzzle and RPG titles lead on Android.
4.Mobile App Retention Statistics for Subscriptions
Subscription retention behaves very differently from free-app retention, and the gap between the two is one of the most quotable figures in mobile data right now.
| Metric | Figure |
|---|---|
| Subscription app D30 retention | 14% |
| Ad-supported app D30 retention | 5.4% |
| Annual subscribers active after 1 year | 25%+ |
| Monthly subscribers active after 1 year | 7.6% |
| Annual plan renewal rate | 83.4% |
| Annual subscriber reactivation rate | 5% (range: 3–8% by category) |
The subscription drop-off is front-loaded: more than half of trial cancellations happen on day one, and Month 1 alone accounts for 35% of all annual subscription cancellations.
This is the single largest concentration across the entire 12-month cycle. Once a user makes it past that first renewal window, retention improves sharply.
First annual renewals see median renewal rates between 23% and 40%, climbing to 44–64% by the second renewal and 56–70% by the third.
But very few users make it that far, and annual plans are especially hard to win back once lost: 95% of subscribers who cancel an annual plan never return, a rate that holds steady regardless of geography, price tier, or discount size.
Monthly subscribers reactivate at roughly 4x that rate.
RevenueCat’s 2026 subscription-app benchmark found that monthly plans retain a median 14–26% of subscribers after six months, compared with just 5–15% for weekly plans.
By category, business apps post the best annual subscription retention, while education apps post the weakest first-month cancellation rates.
Within subscription products specifically, streaming subscriptions post the strongest day-30 retention among subscription verticals, at roughly 14%. Travel and fintech subscription products, by comparison, trail at around 2–3%.
The gap highlights that subscription apps do not inherently retain users better across every category. Retention is influenced by the product’s use case, engagement frequency, and the value users derive from continued access.
5. Mobile App Retention Statistics and Acquisition Economics
Retention and acquisition cost are inseparable in practice, since the entire economics of paid user acquisition depend on how long a paid install stays around.
| Metric | Figure |
|---|---|
| Average iOS cost per install, Q1 2026 | $5.84 (up 19% YoY) |
| Average Android cost per install, Q1 2026 | $1.92 (up 8% YoY) |
| Apple Search Ads average CPI | $2.96 (lowest among major iOS channels) |
| Apple Search Ads day-30 retention vs. iOS network average | 38% stronger |
| Organic install retention vs. paid install retention | 15–30% higher |
| Global ATT opt-in rate (2026) | 27% |
| ATT opt-in rate, United States | 31% |
| ATT opt-in rate, European Union | 22% |
| ATT opt-in rate, Japan | 38% |
Apple Search Ads’ retention premium is notable because it directly affects payback math: an install that retains 38% better effectively lowers the real cost of acquisition even when the sticker-price CPI looks similar to other channels.
App Tracking Transparency opt-in rates matter because they influence how much retention and attribution data can be measured at the individual-user level.
In 2026, global opt-in rates have plateaued at around 27%, after rising steadily since 2022.
6. Mobile App Retention Statistics: Reading a Retention Curve
Raw benchmark numbers matter less than understanding the shape of a retention curve, since two apps with identical day-30 numbers can be in very different positions depending on where their curve flattens.
A retention curve typically drops steeply through the first week, decelerates through day 30, and then, for healthy products, flattens into a long, shallow tail rather than continuing toward zero.
The point where that curve levels off is often more informative than any single day-N figure, since it approximates the size of an app’s durable, habitual user base.
A 2026 Adjust benchmark puts median global retention at 26% on day 1, 13% on day 7, and 7% on day 30, with iOS at 27%, 14%, and 8% respectively.
A sustained retention plateau can be a useful signal of habitual usage, but there is no universal retention threshold that independently establishes product-market fit.
Two practical implications follow from this.
First, comparing two apps purely on a single checkpoint, day 30 for example, can be misleading if one app’s curve is still descending sharply at that point while the other has already flattened.
Second, week-over-week retention past day 30 tends to stabilize in the low single digits for most categories, generally in the 2–4% range, which means the real test of a product’s health happens well beyond the 30-day window most benchmark reports focus on.
Cohort quality compounds this further. Organic installs typically retain 15–30% better than paid installs across most categories.
This means an app that scales paid acquisition aggressively can see its blended retention curve decline even while product quality stays flat or improves, purely as a function of cohort mix shifting toward lower-intent paid traffic.
7. Mobile App Retention Statistics by Region
Retention is not evenly distributed across geographies, and the gaps are large enough to change how a global launch should be evaluated.
| Region | Retention position |
|---|---|
| Japan | Highest average app retention rate globally |
| India | Lowest average app retention rate globally |
| Eastern Europe | Highest average subscription retention rate |
| India & SEA | Lowest average subscription retention rate |
The data across both free-app and subscription models reveals a consistent pattern: India ranks at or near the bottom for retention across nearly every report reviewed, regardless of app category.
Fintech data points to a similar regional variation, with MENA and Europe generally recording stronger retention, while LATAM and North America tend to trail.
However, rankings vary by category, underscoring the importance of evaluating regional retention benchmarks within the specific app vertical rather than treating any region as a universal leader.
8. Why Users Leave: Uninstall and Churn Statistics
Retention statistics only tell half the story. The other half is causation: what actually drives users to leave.
- 88% of users would abandon an app after encountering bugs or glitches.
- 51% would stop using an app entirely if issues occurred on a daily basis.
- Nearly 90% of users have abandoned an app because of poor performance at some point.
- Push notification opt-in users retain at nearly 2x the rate of users who decline notifications.
- Apps that activate users within the first three minutes see nearly 2x higher retention than apps with slower time-to-value.
- Personalizing the onboarding flow can lift day-7 retention by up to 20 percentage points compared to generic, one-size-fits-all onboarding.
Quality and performance, not just product-market fit, are directly tied to whether an install survives past day one.
For teams shipping cross-platform apps specifically, catching these regressions before release increasingly means investing in React Native automated testing rather than relying on manual QA passes alone.
For more depth research into mobile app testing statistics, see here.
This is consistent with the broader retention data above: apps with rougher first-run experiences and slower time-to-value fall into the bottom half of every benchmark table shown so far, regardless of category or platform.
9. Mobile App Retention Statistics and the Market Outlook
The stakes behind these numbers are rising, not falling.
Apple reports the App Store now has over 850 million average weekly users across 175 countries and regions, while Google Play serves 2.5 billion+ monthly users and generated an estimated $49.2 billion in consumer spend in 2025.
Apple also reported that the App Store ecosystem generated more than $1.4 trillion in developer billings and sales in 2025, including $149 billion from digital goods and services and $151 billion from in-app advertising.
Sensor Tower reports that consumers spent 5.3 trillion hours in iOS and Google Play apps in 2025, up 3.8% year over year, while global app downloads reached nearly 150 billion, up 0.8%.
Check out our in-depth Google Play and App Store Statistics.
In-app purchases and paid apps and games generated $167 billion in 2025, up 10.6% year over year, showing that the mobile market is increasingly competing on engagement and monetization rather than download volume alone.
At that scale, even small percentage-point shifts in day-30 retention translate into enormous absolute numbers of lost users. At the same time, growth in raw downloads has slowed.
Global app downloads grew just 0.8% year over year in 2025, while app revenue rose 10.6% over the same period, a clear signal that the industry is shifting from acquisition to retention and monetization efficiency.
That shift is also fueling investment in the tooling layer: the global mobile application testing services market was valued at $7.70 billion in 2025.
The same market is projected to reach $19.84 billion by 2031, growing at a 17.09% CAGR, as more companies invest in AI-powered mobile app testing as a retention lever rather than a release-day checkpoint.
Conclusion
The data across every major source tells the same story: retention, not downloads, is the real measure of a mobile app’s health.
Day-one retention averages roughly 25%, but that figure collapses to single digits within 30 days across nearly every platform and category.
Subscription apps, despite performing meaningfully better than free apps, still see 95% of annual cancellations never return.
The apps that buck this trend share a common thread: fewer bugs, faster performance, and stronger first-session experiences that deliver value within minutes rather than days.
Teams looking to operationalize that quality layer can use AI-powered mobile app testing to automate validation across real devices.
With 88% of users citing bugs and roughly 90% citing poor performance as reasons for abandoning an app, quality has become inseparable from growth.
As the mobile app testing market grows toward $19.84 billion by 2031, and as acquisition costs keep climbing on both major platforms, that connection between reliability, activation speed, and retention is only going to matter more.
FAQs
Q: What is a good mobile app retention rate in 2026?
A: Cross-industry benchmarks are around 25–26% on day 1, 11–13% on day 7, and 5–7% on day 30. However, a good retention rate varies significantly by category and platform. Fintech and social apps typically retain users better than gaming and e-commerce apps at day 30.
Q: What is the average app retention rate on iOS vs. Android?
A: iOS apps average approximately 25.4% day-1 retention and 5.3% day-30 retention, compared with 20.2% and 3.8% on Android. Based on these benchmarks, iOS retention is about 1.33× higher than Android by day 30.
Q: How many users does the average app lose by day 30?
A: Most mobile apps lose more than 90% of their users within 30 days. A typical app can lose roughly 75% of users within the first three days, while even popular mobile games can experience churn above 80%. Retention varies considerably by category, acquisition source, and onboarding quality.
Q: Do subscription apps retain users better than free apps?
A: Generally, yes. Subscription apps retain around 14% of users by day 30, compared with approximately 5.4% for ad-monetized apps. However, retention varies by vertical, with subscription streaming apps performing better than some travel and fintech subscription products.
Q: Which country has the highest mobile app retention?
A: Japan has the highest average mobile app retention rate in global benchmarks, while India ranks among the lowest. Country-level retention can vary significantly based on app category, acquisition strategy, device mix, and user behavior.
Q: What causes users to abandon mobile apps?
A: Bugs, poor performance, and slow time-to-value are major causes of app abandonment. Studies report that 88% of users abandon apps after encountering bugs, while nearly 90% have stopped using an app because of poor performance. Apps that deliver value within the first three minutes can achieve nearly twice the retention of slower-to-activate apps.
Q: Which mobile app category has the best retention?
A: News and magazine apps typically rank among the strongest categories for retention, while generative AI and photo/video apps tend to have lower retention. By day-1 retention, fintech apps lead major categories at around 22%, although benchmarks vary by data provider and measurement methodology.
Q: Does acquisition channel affect mobile app retention?
A: Yes. Organic installs typically retain 15–30% better than paid installs across many categories. Paid channels also differ significantly: Apple Search Ads installs have been reported to deliver approximately 38% stronger day-30 retention than the average iOS ad network, making acquisition quality an important part of retention and payback analysis.
Q: How reliable are mobile app retention benchmarks?
A: Retention benchmarks should be treated as directional rather than universal. Many frequently cited figures come from studies published several years ago, while different analytics providers use different definitions, cohorts, and measurement methods. Always check the publication year, data source, cohort definition, and retention methodology before comparing benchmarks.
Q: What is the difference between classic and rolling retention?
A: Classic retention measures whether a user returns on a specific day, such as day 30. Rolling retention measures whether the user returns on or after that day. Because they measure different behaviors, the two metrics should not be compared directly when evaluating app retention benchmarks.