

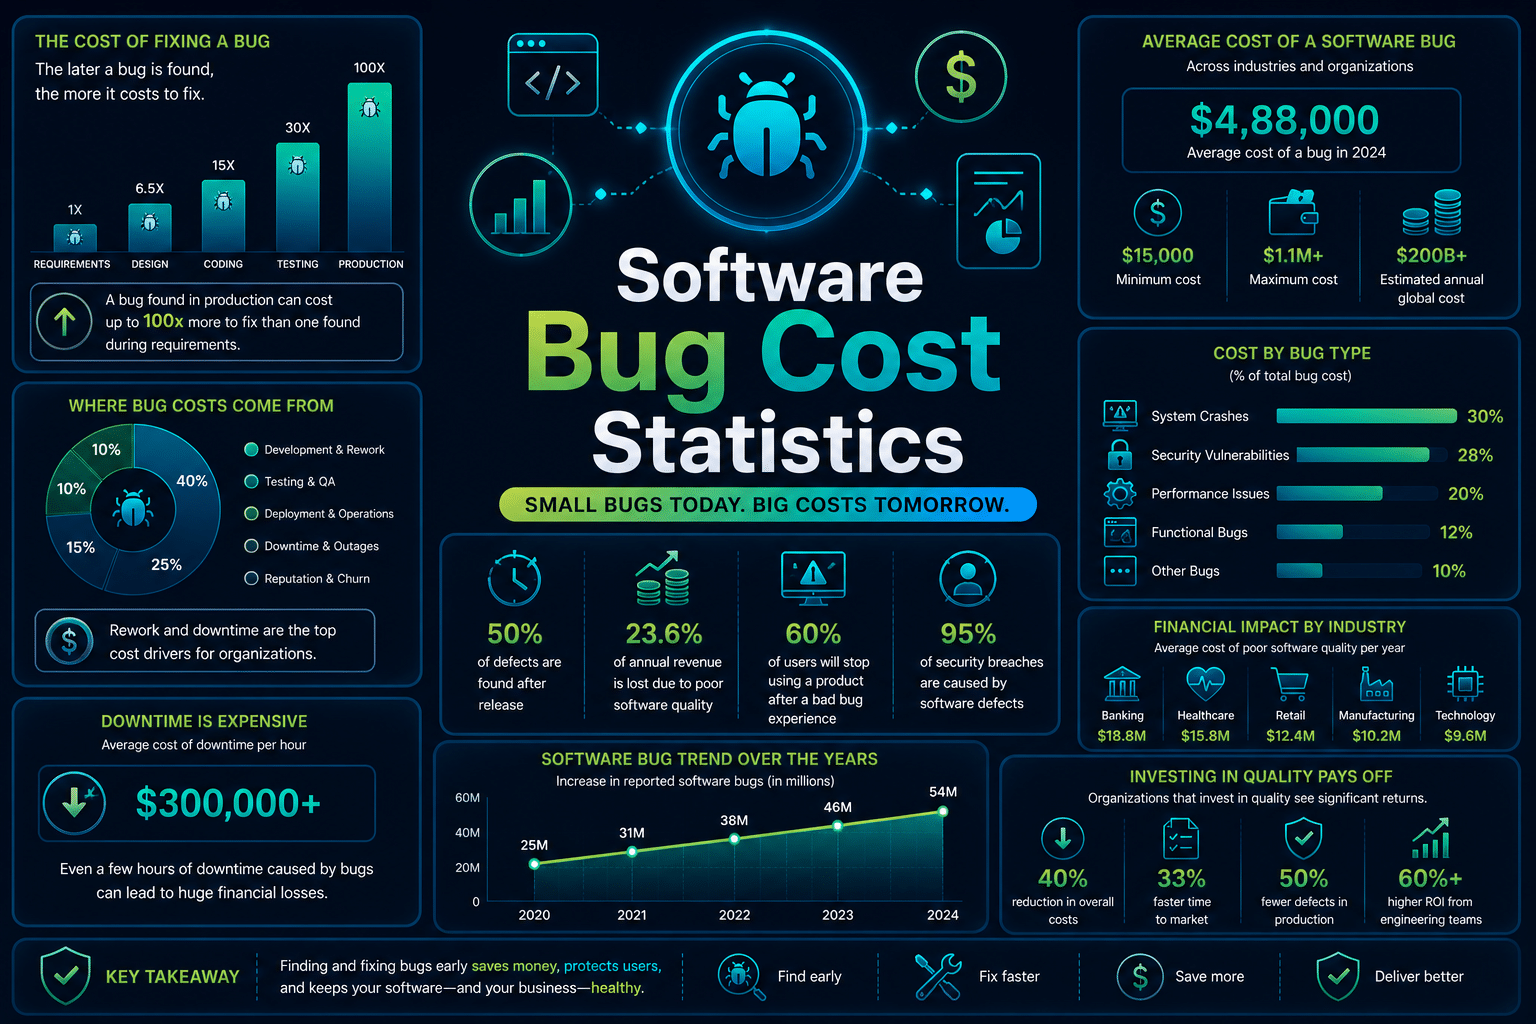

Poor software quality costs the United States at least $2.41 trillion a year, and a single production outage can wipe out a company’s market value in under an hour.
In 2024, a single defective software update from CrowdStrike cost Fortune 500 companies $5.4 billion in direct losses in one weekend.
Software bugs are no longer a back-office engineering concern. They show up on balance sheets, in insurance filings, and in boardroom risk assessments. As software eats a larger share of every industry, the cost of getting it wrong scales with it.
This article breaks down what software bugs actually cost in 2026: the macro economic picture, downtime and outage costs, real-world incidents with verified price tags, developer time lost to debugging, and how the rise of AI-generated code is changing the equation.
Key Software Bug Cost Statistics: Takeaways
- Poor software quality cost the US economy at least $2.41 trillion in 2022, the most recent year with published data.
- Accumulated software technical debt in the US reached approximately $1.52 trillion.
- Operational software failures were estimated at $1.56 trillion.
- Unsuccessful IT/software projects cost an estimated $260 billion.
- Over 90% of midsize and large enterprises report that one hour of downtime now costs more than $300,000.
- 41% of enterprises say hourly downtime costs them $1 million to over $5 million.
- A single software bug at Knight Capital caused $440 million in losses in 45 minutes in 2012.
- Developers report spending over 17 hours a week on maintenance work like debugging and refactoring.
Software Bug Cost Statistics at a Glance
| Metric | Figure |
| Total cost of poor software quality (US, 2022) | $2.41 trillion+ |
| Accumulated technical debt (US) | ~$1.52 trillion |
| Operational software failures | $1.56 trillion |
| Unsuccessful IT/software projects | $260 billion |
| Enterprises reporting >$300K/hour downtime cost | 90%+ |
| Enterprises reporting $1M–$5M+/hour downtime cost | 41% |
| Knight Capital single-bug loss | $440 million in 45 minutes |
| CrowdStrike outage cost to Fortune 500 (ex-Microsoft) | $5.4 billion |
| Developer time on maintenance/debugging | 17+ hours/week |
| Global software testing market (2026 → 2031) | $54.44B → $99.94B |
Software Bug Cost Statistics: A Deep Dive
1. Software Bug Cost Statistics: The Macro Picture
The Consortium for Information & Software Quality (CISQ)’s biennial report is the primary source behind the trillion-dollar figures repeated across the industry.
| Cost component | Estimated figure |
| Total cost of poor software quality (US) | $2.41 trillion+ |
| Accumulated technical debt | ~$1.52 trillion |
| Operational software failures | $1.56 trillion |
| Unsuccessful IT/software projects | $260 billion |
The $2.41 trillion figure is described as an estimate (“has grown to at least $2.41 trillion”), and technical debt, described as an accumulated liability, is treated separately from the annual operational-failure and failed-project figures.
Different secondary sources sum these components inconsistently, so they’re kept listed separately here rather than forced into a single, cleanly-additive total.
For context: cybercrime losses tied to software vulnerabilities rose 64% between 2020 and 2021, and a further 42% between 2021 and 2022, underscoring that bug-driven cost isn’t confined to direct engineering rework. It compounds into security exposure too.
Security defects are another major source of software quality cost.
NIST researchers analyzing software weaknesses exploited between 2021 and 2024 found that only a relatively small subset of weakness types are repeatedly exploited in real-world attacks.
This highlights the importance of prioritizing remediation efforts on high-risk defect categories rather than treating every bug equally.
Software Bug Cost Statistics: Why Technical Debt Drives Software Bug Costs
Technical debt is more than aging code.It represents future engineering work created by shortcuts taken during development.
As software systems grow, unresolved technical debt makes defects harder to isolate, increases regression risk, slows releases, and raises the effort required to implement even small feature changes.
The Consortium for Information & Software Quality (CISQ) estimates accumulated US technical debt at approximately $1.52 trillion, making it one of the largest contributors to software quality costs.
Software Bug Cost Statistics: Security Debt Continues to Grow
Software quality costs extend beyond reliability and downtime into long-term security maintenance. According to Veracode’s 2025 State of Software Security report:
- 76% of applications contain at least one security flaw.
- 50% of organizations carry critical security debt, meaning high-severity vulnerabilities remain unresolved across multiple release cycles.
- Only 8.4% of software flaws are simultaneously high in both severity and exploitability, showing why organizations increasingly prioritize risk-based remediation instead of attempting to fix every issue immediately.
These findings show that reducing software bug costs isn’t simply about fixing more bugs—it’s about fixing the bugs that create the greatest operational and financial risk.
2. Software Bug Cost Statistics: Across the Software Development Lifecycle
One of the most consistently cited findings in software engineering is that defects become dramatically more expensive the later they are discovered.
Industry guidance from IBM and the National Institute of Standards and Technology (NIST) continues to show that finding defects during requirements gathering or design is substantially cheaper than fixing them after production deployment.
For engineering organizations, this reinforces why investments in code review, automated testing, continuous integration, and shift-left quality practices frequently deliver a positive return.
Preventing defects before release generally costs far less than recovering from production outages, emergency patches, customer support escalations, and reputational damage.
3. Software Bug Cost Statistics: Downtime and Outage Costs
Beyond the macro estimate, downtime research gives a more granular, verifiable picture of what an outage costs in real time.
The annual Hourly Cost of Downtime Survey, now in its 11th year, is one of the most widely cited independent studies in this space.
| Downtime cost tier | Share of enterprises |
| More than $300,000 per hour | 90%+ of midsize/large enterprises |
| $1 million to over $5 million per hour | 41% of enterprises |
| Over $100,000 per hour | 97% of enterprises with 1,000+ employees |
| Over $5 million per hour (top verticals: banking, healthcare, government, retail, utilities) | Average for these sectors |
These figures exclude litigation, regulatory penalties, and reputational damage, meaning the true cost of an extended outage in a regulated industry can run considerably higher than the headline average.
4. Software Bug Cost Statistics: Real-World Incidents
Aggregate figures can feel abstract. Two well-documented, single-incident case studies show what a specific software defect can cost in practice.
| Incident | Year | Cost | Details |
| Knight Capital trading glitch | 2012 | $440 million lost in 45 minutes | Dormant legacy code (Power Peg) was accidentally reactivated during a deployment, triggering roughly 4 million unintended trades across 154 stocks |
| CrowdStrike global IT outage | 2024 | $5.4 billion in direct losses to Fortune 500 companies (excl. Microsoft) | A faulty Falcon sensor update crashed over 8.5 million Windows devices worldwide |
Within the CrowdStrike incident, losses were heavily concentrated in a handful of sectors:
| Sector | Estimated direct loss |
| Healthcare | $1.94 billion |
| Banking | $1.15 billion |
| Airlines | $860 million |
The weighted average loss per Fortune 500 company was estimated at $44 million, ranging from $6 million for manufacturing firms up to $143 million for airlines. Cyber insurance was expected to cover only 10% to 20% of the total damages.
5. Software Bug Cost Statistics and Developer Time
A meaningful share of the cost of bugs shows up before an incident ever happens, in the engineering hours spent finding and fixing defects rather than shipping new work.
- Developers report spending more than 17 hours a week on maintenance tasks such as debugging and refactoring, categorized as “toil” work.
- 61% of developers spend more than 30 minutes a day just searching for answers to technical problems.
- Most organizations estimate 5–15 hours per developer per week are lost to unproductive work that could be automated, optimized, or eliminated.
Time lost to debugging is time not spent building, and at scale across an engineering organization, it becomes one of the largest recurring line items in software delivery cost, even before a single production incident occurs.
As software systems become larger and more interconnected, debugging effort increasingly includes understanding dependencies, validating AI-generated code, reproducing production issues, and coordinating fixes across multiple services.
These indirect engineering costs rarely appear in financial reports but materially reduce software delivery capacity over time.
Software Bug Cost Statistics: Software Complexity Is Making Bugs Harder to Eliminate
Engineering teams are also spending more time fixing issues that remain unresolved.
According to Veracode’s 2025 State of Software Security report:
- The average time required to remediate software security flaws has increased by 47% since 2020.
- 70% of applications contain vulnerabilities in third-party code, making dependency management one of the fastest-growing contributors to software maintenance effort.
As organizations adopt larger open-source ecosystems and AI-assisted development, debugging increasingly involves validating dependencies, software supply chains, and generated code—not just internally written software.
6. Software Bug Cost Statistics: AI Coding Era
The rise of AI-generated code is changing where bug-related cost shows up, and early survey data suggests it isn’t necessarily shrinking it.
- 66% of developers say AI-generated code is often “almost right, but not quite,” requiring additional review.
- 45% of developers say debugging AI-generated code is more time-consuming than debugging code written by a human.
- Sentiment toward AI coding tools has cooled slightly, with positive sentiment dropping from over 70% in 2023 and 2024 to 60% in 2025.
This matters directly for the cost equation: if AI tools accelerate code generation but increase the review and debugging burden, the net effect on total cost of poor software quality depends heavily on whether that generated code is validated before it reaches production.
Recent industry research also suggests that AI-assisted development creates a quality tradeoff.
While generative AI can significantly improve developer productivity, Google’s DORA researchers found that increased AI adoption may reduce software delivery stability because teams produce more code that must still be reviewed, validated, and maintained.
Faster code generation does not automatically translate into fewer production defects without equally mature testing and review practices.
Google’s 2025 DORA Report, based on responses from nearly 5,000 technology professionals worldwide, found that AI primarily amplifies existing engineering practices rather than replacing them.
Organizations with mature testing, CI/CD, and quality engineering processes benefit the most from AI-assisted development, while weaker engineering practices can experience increased software delivery instability as code generation accelerates faster than validation.
7. Software Bug Cost Statistics: Software Supply Chain Risk
Modern software bugs increasingly originate outside an organization’s own codebase.
Veracode’s 2025 State of Software Security report found that:
| Statistic | Figure |
| Applications containing third-party code vulnerabilities | 70% |
| Applications containing first-party code vulnerabilities | 64% |
As organizations rely on open-source packages, cloud SDKs, and external libraries, software quality now depends just as much on maintaining dependencies as
riting defect-free internal code. This has made software supply chain management an increasingly important part of reducing bug-related costs.
8. Software Bug Cost Statistics: Market Outlook
The scale of investment flowing into software testing and quality tooling reflects how seriously the market is treating this cost.
The global software testing market is projected to grow from $54.44 billion in 2026 to $99.94 billion by 2031, with automation and AI-augmented testing platforms among the fastest-growing segments.
Much of this investment is being driven by growing adoption of AI-assisted development, increasing software complexity, and the rising financial impact of downtime.
Organizations are placing greater emphasis on automated testing, continuous quality monitoring, and earlier defect detection because preventing production failures is generally less expensive than recovering from them after deployment.
This shift reflects a broader industry trend toward continuous software quality management.
As organizations accumulate larger codebases, third-party dependencies, and AI-generated code, investment is increasingly moving beyond traditional QA toward automated testing, software composition analysis, and continuous security validation.
That growth trajectory lines up with the underlying economics: when a single defect can cost $440 million in 45 minutes, or when 90% of enterprises are staring down six-figure hourly downtime costs, spending on prevention becomes far cheaper than the alternative.
Conclusion
The numbers all point in the same direction: software bugs are a trillion-dollar-scale economic problem, not an engineering footnote.
The $2.41 trillion estimate for the cost of poor software quality in the US, the finding that 90%+ of enterprises face six-figure hourly downtime costs, and single incidents like CrowdStrike’s $5.4 billion Fortune 500 impact all describe the same underlying reality from different angles.
The connective tissue between all of these figures is time: time developers lose debugging instead of building, and time systems stay down before a fix ships.
As AI-generated code adds a new debugging burden on top of existing workloads, and as the software testing market grows toward $99.94 billion by 2031 in response, the organizations that treat quality as a cost center rather than a risk-reduction investment are the ones most exposed to being the next data point in a report like this one.
The organizations that consistently reduce software bug costs are not necessarily those writing fewer lines of code.
They are the ones detecting defects earlier, managing technical debt proactively, and integrating quality assurance throughout the software development lifecycle instead of treating testing as the final release gate.
FAQs
How much do software bugs cost the US economy? Poor software quality cost the US economy at least $2.41 trillion in 2022, the most recent year with published data.
What is the most expensive known software bug? The 2024 CrowdStrike outage is the most expensive documented single software-quality incident, costing Fortune 500 companies an estimated $5.4 billion in direct losses. At the single-company level, Knight Capital’s 2012 trading glitch remains one of the most cited examples, at $440 million lost in 45 minutes.
How much does IT downtime cost per hour? Over 90% of midsize and large enterprises report that one hour of downtime costs more than $300,000, and 41% report costs of $1 million to over $5 million per hour.
How much time do developers spend debugging? Developers report spending more than 17 hours a week on maintenance work including debugging and refactoring.
Is AI-generated code harder to debug? Survey data suggests it can be: 45% of developers say debugging AI-generated code takes more time than debugging human-written code.
How big is the software testing market? The global software testing market is projected to grow from $54.44 billion in 2026 to $99.94 billion by 2031.
What portion of software quality cost is technical debt? Accumulated US technical debt was estimated at approximately $1.52 trillion.