

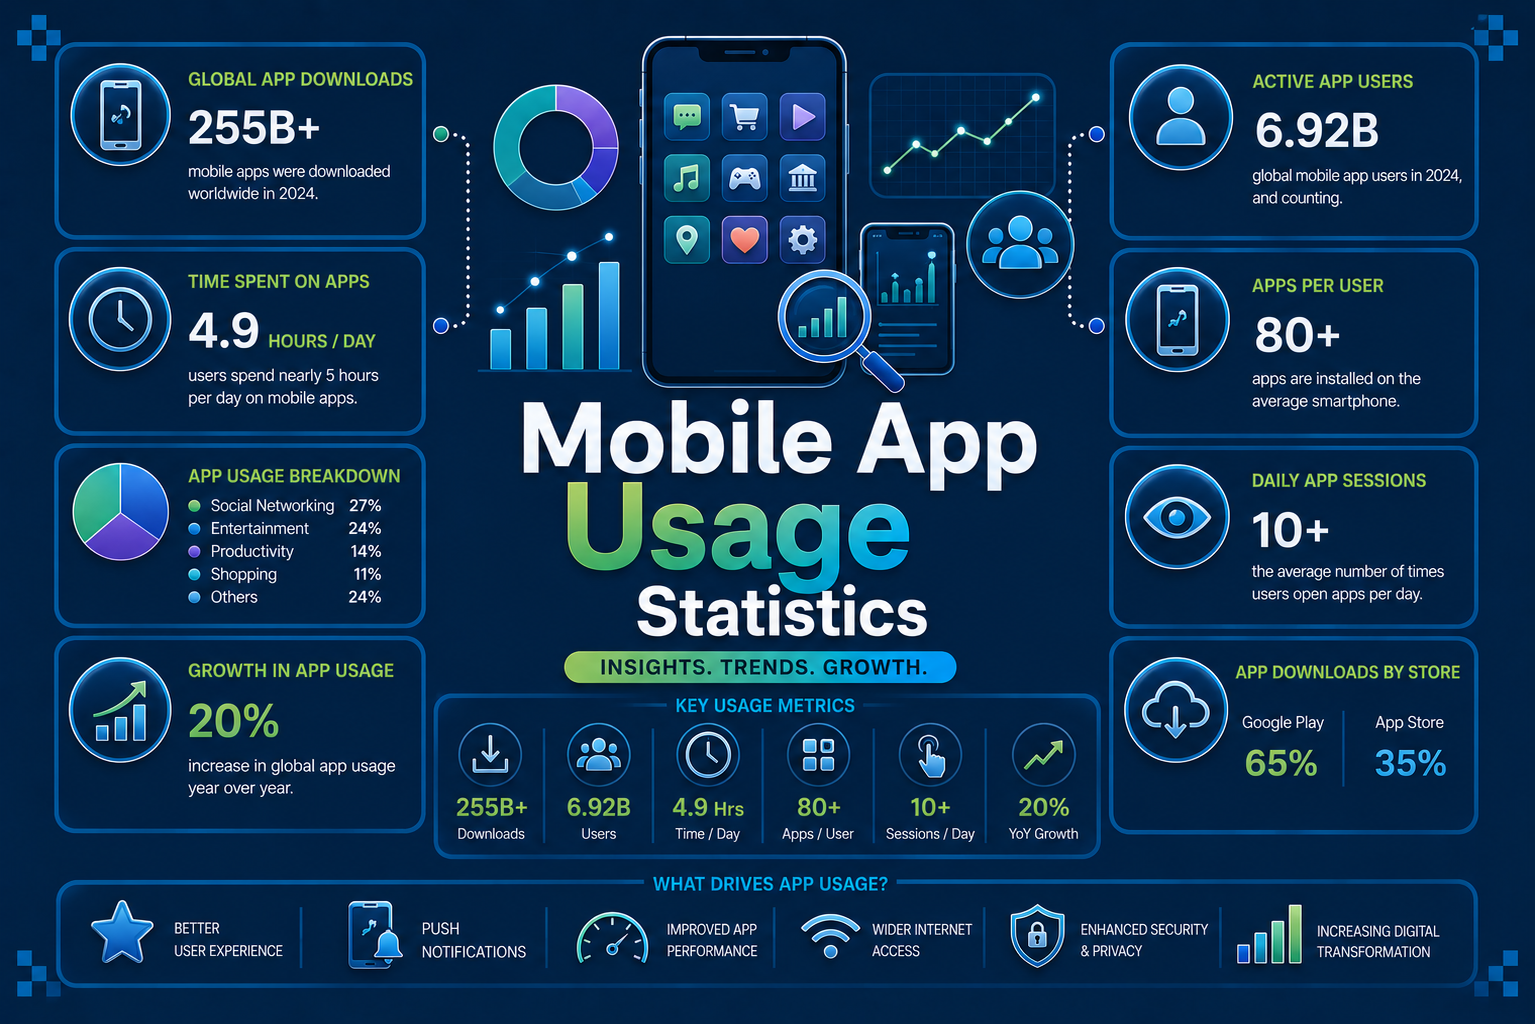

Mobile users spent 5.3 trillion hours inside apps in 2025, averaging 3.6 hours per day per user, according to Sensor Tower’s State of Mobile 2026 report.
That time is not spread evenly. Social media alone absorbed nearly 2.5 trillion of those hours, while time spent in generative AI apps surged 426% year over year.
This mobile app usage statistics article looks at how people actually use mobile apps once installed, covering time spent, session frequency, retention and churn, category-level engagement shifts, generative AI usage growth, push notification behavior, and regional usage patterns.
For a companion look at the download and revenue side of this same market, see our mobile app download and revenue statistics.
Key Insights and Takeaways
- Total global time spent in apps reached 5.3 trillion hours in 2025, up 3.8% year over year.
- The average mobile user spends 3.6 hours per day in apps and opens roughly 10 apps daily, out of about 34 apps used per month.
- Consumers spent nearly 2.5 trillion hours on social media apps in 2025, equal to more than 90 minutes per day for the average mobile user, up 5% year over year.
- Time spent in generative AI apps hit 48 billion hours in 2025, roughly 3.6 times the 2024 total, and is projected to reach 36 billion hours in H1 2026 alone.
- ChatGPT’s total time spent grew 426% year over year in 2025, the fastest engagement growth of any major app.
- AI Assistants became the 10th-largest app category by total time spent in 2025 despite being a much newer category than social or gaming.
- Average industry-wide app retention sits at roughly 25 to 26% on Day 1, 11 to 13% on Day 7, and 5 to 7% on Day 30.
- India ranks first worldwide by total time spent in apps, ahead of Indonesia and the United States.
- The average US smartphone user receives around 46 push notifications per day, and sending even one per week can push 6% of users to uninstall an app.
- Entertainment apps post the longest average session length of any major category, at roughly 7 minutes per session.
- 96.2% of internet users access the internet via a mobile phone at least some of the time.
- Gaming app time spent still grew 0.9% year over year in 2025 even as gaming downloads fell 7.2%, showing existing players are using games more even as fewer new users join.
At a Glance: Mobile App Usage Statistics Summary
| Metric | Figure |
| Total time spent in apps (2025) | 5.3 trillion hours |
| Average daily time in apps per user | 3.6 hours |
| Average apps used per month | 34 |
| Average apps used per day | approximately 10 |
| Time spent on social media apps (2025) | approximately 2.5 trillion hours (90+ min/day per user) |
| Generative AI app time spent (2025) | 48 billion hours |
| ChatGPT time spent growth (2025 YoY) | +426% |
| Day 1 / Day 7 / Day 30 retention (cross-category average) | approximately 25-26% / 11-13% / 5-7% |
| Top market by time spent in apps | India, then Indonesia, then United States |
| Daily push notifications received (US average) | approximately 46 |
| Mobile share of global web traffic | approximately 51.6% to 52.5% |
| Share of internet users accessing via mobile | 96.2% |
Mobile App Usage Statistics: A Deep Dive
1. Mobile App Usage Statistics: Time Spent and Daily Engagement
Time spent, not downloads, is the metric Sensor Tower highlights as the real signal of mobile app usage health in its 2026 report.
Total time spent across iOS and Google Play reached 5.3 trillion hours in 2025, up 3.8% year over year, even as download growth slowed to just 0.8%.
Sensor Tower also reported that global consumer spending on in-app purchases, subscriptions, and paid apps reached $171 billion in 2025, a 10.7% year-over-year increase despite relatively flat download growth.
On a per-user basis, the average mobile user now spends 3.6 hours per day inside apps, a 1.1% increase from the prior year.
That attention is concentrated. Social media apps alone accounted for close to 2.5 trillion hours, or more than 90 minutes a day for the typical user, a 5% increase year over year.
- Total time spent in apps: 5.3 trillion hours in 2025, +3.8% YoY.
- Average daily in-app time per user: 3.6 hours, +1.1% YoY.
- Social media time spent: approximately 2.5 trillion hours, over 90 minutes per day per average user, +5% YoY.
- Mobile share of global web traffic: 51.6% to 52.5%.
- Share of internet users who access the web via mobile at least sometimes: 96.2%.
At the individual app level, TikTok users average 1 hour 37 minutes per day on the Android app, ahead of YouTube, Instagram at 1 hour 13 minutes, Facebook at 67 minutes and WhatsApp at 59 minutes.
| App | Average Daily Time per User (Android) |
| TikTok | 1h 37m |
| 1h 13m | |
| 1h 07m | |
| 59m |
Engagement at this scale is fragile to slowdowns, which is why teams increasingly build automated performance testing into every release rather than testing speed only before major launches.
2. Mobile App Usage Statistics: Sessions, Frequency and Session Length
How often people open an app, and how long they stay, varies sharply by category.
Business of Apps and Airship data cited by eMarketer show Entertainment apps have the longest average session length of any major category, at roughly 7 minutes.
This is more than twice the next-highest category tracked between April 2022 and June 2025.
Sports apps are opened the most times per month of any category, while food and drink and shopping apps are opened least frequently, reflecting their more occasional, task-based use.
- Average session length, Entertainment category: approximately 7 minutes, the longest of any tracked category.
- Sports apps: highest monthly open frequency of any tracked category.
- Food & drink and shopping apps: lowest monthly open frequency of tracked categories, consistent with occasional, task-driven use.
- News & magazines apps: highest share of active users opening the app once per day, reflecting habitual daily-check behavior.
- Average apps opened per day across all categories: approximately 10.
- Average apps used per month: 34, up 5.4% year over year.
| Category | Usage Pattern |
| Entertainment | Longest average session length (approximately 7 minutes) |
| Sports | Highest monthly open frequency |
| News & Magazines | Highest share of users opening once daily |
| Food & Drink / Shopping | Lowest monthly open frequency |
Session length in particular tracks app responsiveness closely, so many teams treat mobile app testing tools as a session-length lever rather than a pre-launch checklist item.
3. Mobile App Usage Statistics: Retention and Churn Behavior
Retention is where mobile app usage statistics get uncomfortable for most developers.
Composite 2025 to 2026 data pooled from Adjust, AppsFlyer, Business of Apps and Sensor Tower puts cross-category retention at roughly 25 to 26% on Day 1, 11 to 13% on Day 7, and 5 to 7% on Day 30.
Subscription apps post Day 30 retention around 14%, roughly 2.5 times the ad-supported category average of about 5.4%, according to AppsFlyer’s State of Subscriptions data.
Hyper-casual games sit at the opposite extreme, with Day 30 retention frequently cited around 2%.
- Cross-category Day 1 retention: approximately 25 to 26%.
- Cross-category Day 7 retention: approximately 11 to 13%.
- Cross-category Day 30 retention: approximately 5 to 7%.
- Subscription app Day 30 retention: approximately 14%, about 2.5 times the ad-supported average.
- Ad-supported app Day 30 retention: approximately 5.4%.
- Hyper-casual gaming Day 30 retention: approximately 2%, a structural feature of ultra-short session formats rather than a product defect.
| Retention Checkpoint | Cross-Category Average |
| Day 1 | 25-26% |
| Day 7 | 11-13% |
| Day 30 | 5-7% |
| Day 30, subscription apps | approximately 14% |
| Day 30, ad-supported apps | approximately 5.4% |
Since even small performance regressions can accelerate Day 1 drop-off.
Closing that gap increasingly means testing under real-world load with mobile automation testing tool rather than relying on staging-environment benchmarks alone.
4. Mobile App Usage Statistics by Category
Category-level usage shifted meaningfully in 2025.
Sensor Tower reports that TikTok topped worldwide apps in downloads, in-app purchase revenue and total time spent simultaneously, an unusually complete sweep across all three core usage metrics.
Gaming usage told a more divided story.
Total time spent in games still grew 0.9% year over year even as gaming downloads fell 7.2%, meaning the existing player base is playing more even as fewer new users are joining.
Revenue concentration also reflects a usage concentration problem: the top 1% of apps generated 92.2% of all in-app purchase revenue in 2025, equal to $154 billion, while the remaining 99% of apps split just $13.1 billion.
- TikTok: led globally in downloads, IAP revenue and total time spent simultaneously in 2025.
- Gaming time spent: +0.9% YoY despite a 7.2% YoY decline in gaming downloads.
- AI Assistants: became the 10th-largest app category by total time spent, up 426% YoY.
- Three apps crossed $1 billion in annual IAP revenue for the first time in 2025: ChatGPT, CapCut and WeTV, none of them games.
- Revenue concentration: the top 1% of apps captured 92.2% of all global IAP revenue in 2025.
- Short Drama ranked among the top three subgenres by growth in both downloads and time spent in 2025.
| Category Shift | 2025 Data Point |
| Social media | Nearly 2.5 trillion hours spent, +5% YoY |
| Gaming | Time spent +0.9% YoY despite downloads -7.2% YoY |
| AI Assistants | 10th-largest category by time spent, +426% YoY |
| Short Drama | Top 3 subgenre by download and time-spent growth |
Categories with the fastest release cadence, including gaming and short drama apps, are especially exposed to UI breakage between updates.
This is one reason their engineering teams lean on self-healing test automation to keep test suites stable as screens change week over week.
5. Mobile App Usage Statistics for Generative AI Apps
Generative AI is the single fastest-growing usage category tracked in mobile today.
Sensor Tower’s State of AI 2026 report shows global time spent on generative AI apps is projected to climb from 17.2 billion hours in H1 2025 to 36 billion hours in H1 2026, more than doubling in a single year.
Full-year 2025 data shows generative AI app time spent reached 48 billion hours, roughly 3.6 times the 2024 total and nearly 10 times the 2023 level.
Generative AI apps also surpassed 1.5 billion downloads globally during 2025, reflecting that rapid engagement growth was matched by continued user acquisition.
Session volume followed a similar curve, surpassing 1 trillion sessions in 2025.
- Generative AI time spent (2025): 48 billion hours, approximately 3.6x the 2024 figure.
- Generative AI time spent (H1 2026 projected): 36 billion hours, up from 17.2 billion hours in H1 2025.
- Generative AI session volume: surpassed 1 trillion sessions in 2025.
- ChatGPT total time spent growth: +426% year over year in 2025.
- ChatGPT became the fastest app in history to reach 1 billion monthly active users, hitting the milestone in May 2026 after roughly three years, faster than TikTok, YouTube or Instagram.
- Market concentration: ChatGPT, DeepSeek and Google Gemini together accounted for nearly 90% of total time spent across AI Assistant apps in Q1 2026.
- ChatGPT’s true audience share, measuring unique users across app and web, fell below 50% for the first time in March 2026 as Google Gemini and Claude gained usage share.
- Claude’s US true audience share more than tripled over the same period, driven largely by web usage growth.
| Generative AI Usage Metric | Figure |
| Time spent, full-year 2025 | 48 billion hours |
| Time spent, H1 2026 (projected) | 36 billion hours |
| Session volume, 2025 | 1 trillion+ |
| ChatGPT time spent growth, 2025 YoY | +426% |
| ChatGPT MAU milestone | 1 billion, reached May 2026 |
This mirrors the adoption curve seen in our AI coding assistant adoption statistics, another sign that AI-driven usage is accelerating across both consumer and developer tools.
6. Mobile App Usage Statistics and Push Notification Behavior
Push notifications remain one of the primary levers apps use to re-engage users, but usage data shows a narrow tolerance window.
The average US smartphone user receives roughly 46 push notifications per day, a figure widely cited from CleverTap research and repeated in current Business of Apps benchmarking.
Frequency directly affects churn. Business of Apps reports that sending just one push notification a week can lead 10% of users to disable notifications and 6% to uninstall the app entirely, underscoring how easily re-engagement tactics can backfire when overused.
- Average daily push notifications received (US): approximately 46.
- Users who disable notifications after one per week: 10%.
- Users who uninstall after one push notification per week: 6%.
- iOS push notification opt-in rate: approximately 51% across app categories on average.
- Users who enable push notifications typically remain active for at least nine sessions, while users who decline notifications are frequently lost after only two sessions.
These patterns matter for mobile app usage because notification strategy sits directly upstream of retention curves.
Apps that over-notify tend to accelerate the same Day 7 and Day 30 drop-off documented in the retention section above.
7. Mobile App Usage Statistics by Region
Regional mobile app usage patterns diverge from regional download patterns, which makes time-spent data a useful cross-check on where engagement is actually concentrated.
Sensor Tower’s State of Mobile 2026 report ranks India first worldwide by total time spent in apps.
This is followed by Indonesia in second place and the United States in third, a ranking that differs from the download and revenue leaderboards.
- Top market by total time spent in apps: India.
- Second by time spent: Indonesia.
- Third by time spent: United States.
- Women aged 16 to 24 spend the most time online globally at roughly 7 hours 35 minutes per day, narrowly ahead of men in the same age bracket at 7 hours 11 minutes.
- Users aged 65 and older spend roughly 4 hours per day online, less than half the time of the youngest cohort tracked.
| Rank | Market | Usage Metric |
| 1 | India | Highest total time spent in apps |
| 2 | Indonesia | Second-highest total time spent |
| 3 | United States | Third-highest total time spent |
8. Mobile App Usage Statistics: Trends Shaping Usage in 2026
The clearest pattern across 2025 and into 2026 is that usage intensity is growing faster than the user base itself.
Sensor Tower frames this directly: downloads grew just 0.8% year over year while time spent grew 3.8% and revenue grew 10.6%, meaning existing users are doing more inside the apps they already have.
Average consumer spending per download also continued to rise in 2025, reinforcing the industry’s shift toward monetizing deeper engagement rather than simply acquiring more installs.
- Food delivery and restaurant app usage grew 14% year over year in 2025, surpassing pandemic-era engagement peaks.
- Sports betting app usage grew 24% year over year globally as new regulated markets, including Brazil, opened up.
- Retail app usage and time spent declined in 2025 as growth from platforms like Temu and Shein slowed and AI shopping assistants began reshaping discovery behavior.
- Active users of generative AI tools reached 2.42 billion globally, equal to 29.2% of the world’s population.
- US digital ad spend targeting AI-themed usage and creative reached $1.3 billion between January and May 2026, up 48% year over year.
As competition for attention intensifies, more teams are treating agentic mobile test automation as part of their usage strategy, not just their release checklist.
Conclusion
Mobile app usage statistics for 2025 and 2026 show a market where attention, not installs, is the real currency.
Users spent 5.3 trillion hours inside apps in 2025, social media alone claimed nearly half of that time, and generative AI usage grew faster than any other category on record, with ChatGPT’s time spent up 426% in a single year.
Maintaining that level of engagement across thousands of device and OS combinations requires consistent validation on a real mobile device testing platform before every release.
The practical takeaway is that usage depth now matters more than usage breadth. Retention curves remain steep across nearly every category, notification fatigue can undo acquisition spend within a single week.
The categories pulling ahead, AI assistants, short drama, and established social platforms, are winning through session frequency and time spent rather than download counts alone.
For anyone building or marketing a mobile product in 2026, the data points toward one conclusion: getting installed is the easy part, keeping people engaged is where the real competition happens.
Teams trying to close that gap between installs and lasting engagement need mobile QA that keeps pace with how intensively their apps are actually used, which is where Panto AI comes in.
FAQ’s
Q: How much time do people spend on mobile apps each day?
A: The average smartphone user spends around 3.6 hours per day using mobile apps, interacting with roughly 10 apps daily and about 34 apps each month.
Q: Which app category gets the most usage time?
A: Social media remains the most-used app category, accounting for nearly 2.5 trillion hours of global usage in 2025. The average user spends more than 90 minutes per day on social platforms.
Q: How fast is generative AI app usage growing?
A: Generative AI apps are growing rapidly. Users spent approximately 48 billion hours in AI apps during 2025, and Sensor Tower projects 36 billion hours in the first half of 2026 alone, putting usage on track to more than double year over year.
Q: What is a good app retention rate in 2026?
A: Across most app categories, healthy benchmarks are around 25–26% Day 1 retention, 11–13% Day 7 retention, and 5–7% Day 30 retention. Subscription-based apps often outperform these averages.
Q: Which country has the highest mobile app usage?
A: India leads the world in total time spent using mobile apps, followed by Indonesia and the United States.
Q: How many push notifications do people receive, and do they affect engagement?
A: The average U.S. smartphone user receives about 46 push notifications per day. Overusing notifications can hurt retention, with studies showing that even one push notification per week can prompt around 6% of users to uninstall an app.
Q: Is mobile app usage still growing in 2026?
A: Yes. Growth is increasingly driven by deeper engagement rather than new downloads. In 2025, time spent in apps grew 3.8% year over year while downloads increased just 0.8%, with generative AI apps leading the next wave of usage growth.