CI pipelines are supposed to give you confidence. Instead, they often do the opposite.
You push a change, everything works locally, and then the pipeline fails. You rerun it. It passes. You merge. A few commits later, something else breaks—again only in CI.
This cycle is one of the most frustrating parts of modern software development. And it’s a continuous, structural problem.
As codebases grow, pipelines become more complex, environments diverge, and tests become harder to keep deterministic. The result: flaky tests, noisy failures, and long debugging cycles.
This guide breaks down:
- why CI pipelines fail when tests pass locally
- a step-by-step process to debug failures
- and how AI can help you automatically diagnose issues faster
Why CI Pipelines Fail When Tests Pass Locally
Local success does not always mean pipeline success.
Your laptop, editor, shell, and runtime are usually more forgiving than a locked-down CI runner. That mismatch creates a gap that hides problems until the pipeline runs.
The local-vs-CI environment gap
CI is a different world. It may use a different OS image, shell, browser, runtime, package manager, or filesystem behavior. It may also run with stricter limits and fewer assumptions than your local machine.
Common differences include:
- Different Node, Python, Java, or browser versions
- Missing environment variables or secrets
- Time zone or locale differences
- Slower CPU, lower memory, or smaller disk space
- Different path handling, permissions, or line endings
The most common causes of CI failures
Most CI breaks come from a small set of repeat offenders.
1. Flaky tests and timing issues
These are the classic “works on my machine” failures. A test might depend on the page loading just a little faster, a network call returning in time, or asynchronous work finishing in the expected order.
Typical signs:
- Race conditions
- Improper waits
- Non-deterministic assertions
- Test cases that depend on previous state
2. Dependency and build mismatches
The code may not be the problem at all. A different lockfile state, package version, browser version, or build artifact can cause a failure that looks like a product bug but is really an environment drift issue.
Look out for:
- Lockfile drift
- Version mismatches
- Hidden global package dependencies
- Build output that differs from local runs
3. Resource and infrastructure constraints
CI runners are often lean by design. A job that passes locally with plenty of memory and CPU might fail in CI because the runner is underpowered, heavily shared, or dealing with intermittent network instability.
Warning signs:
- Timeouts
- OOM failures
- Slow test startup
- Parallel job contention
4. Test data and test isolation issues
Shared state is a quiet source of pain. If tests reuse the same account, database, fixture, or storage location, one run can poison another. Failures can also appear when cleanup is incomplete.
Here’s what might happen:
- Shared fixtures
- Reused accounts or databases
- Order-dependent tests
- Unclean teardown between runs
Signs the problem is a CI-only failure
You can usually spot a CI-only issue by pattern.
Look for these clues:
- The same test passes locally and fails in CI
- The failure appears only on certain runners or branches
- Rerunning the job changes the outcome
- Logs show timeout, stale state, or environment-specific errors
Why UI and end-to-end tests fail more often in CI
End-to-end tests are usually the first to break in CI because they depend on more moving parts than unit tests.
They rely on browser rendering, network timing, asynchronous UI state, and selectors that may be brittle under slower execution.
A test that looks stable on a developer machine can fail in CI simply because the app loads more slowly, animations behave differently, or a UI element appears a few hundred milliseconds later than expected.
Why this matters for CI reliability
UI and E2E failures create outsized noise because they are expensive to debug and easy to dismiss as flaky.
That makes them a major source of developer distrust in the pipeline. If a team can stabilize these tests, CI becomes much more credible and much easier to operate.
Common CI-only failures in Playwright, Selenium, and Appium
The most common issues include:
- selectors that are too fragile
- fixed waits instead of proper synchronization
- race conditions around page navigation or rendering
- device or browser differences between local and CI
- state that leaks between test runs
- mobile-specific timing issues in Appium and Detox-style flows
What usually fixes these failures
The goal is not to make the test pass eventually. The goal is to make it deterministic. That usually means:
- using stable selectors
- waiting for the right UI state instead of waiting for time
- isolating test data and sessions
- reducing cross-test dependencies
- capturing screenshots, traces, or videos when failures happen
Step-by-Step Process to Debug a Failing CI Pipeline
The fastest way to fix a broken pipeline is to stop guessing. Use a repeatable workflow instead of jumping straight to code changes.
Step 1: Reproduce the failure in the same environment
Match the CI runner image, OS, browser, and runtime version as closely as possible. If you can run the same command inside a container locally, do that first.
Your goal is simple:
- Confirm whether the failure is deterministic
- Capture the exact commit that broke
- Verify the job configuration
- Remove differences between local and CI runs
When the environment is identical, the mystery usually shrinks fast.
Step 2: Start with the first real error
Do not chase the last error blindly. CI logs often contain a cascade of failures. The final error may just be a symptom of an earlier problem. Read the logs both top to bottom and bottom to top.
Focus on:
- The first stack trace that looks meaningful
- The earliest build or setup failure
- The first assertion that truly failed
- Any unexpected exit before the test itself completes
Inspect the artifacts before changing code
Before making any code changes, inspect everything the pipeline gives you. CI artifacts often contain the exact clue that explains the failure.
The most useful artifacts are usually logs, screenshots, videos, traces, coverage reports, and test output files.
Logs
Logs should help you identify the first real failure, not just the final symptom. Look for:
- the first stack trace
- unexpected exits
- timeout messages
- dependency installation failures
- browser or runner startup issues
Screenshots and videos
For UI tests, screenshots and videos often make the failure obvious. They can reveal:
- selectors pointing to the wrong element
- a modal blocking interaction
- a page not fully loaded
- a layout shift or rendering issue
- a missing login or session state
Traces and structured test reports
Trace files and structured reports are especially useful when the failure is intermittent. They can show:
- the exact sequence of events before the failure
- whether the test was waiting correctly
- which step broke first
- whether the failure was in the app, the test, or the environment
Coverage and build output
Sometimes the failure is not in the test at all. Build output and coverage artifacts can expose:
- mismatched build steps
- missing dependencies
- compile-time errors
- incorrect environment configuration
Step 3 — Compare local and CI setup line by line
The goal here is to expose differences.
Environment variables
Check whether CI is missing env vars that exist locally.
Compare:
- Secrets
- Feature flags
- Service endpoints
- Config files
- Auth credentials
Dependency versions
Versions matter more than people expect.
Compare:
- Lockfiles
- Resolved package versions
- Browser versions
- OS-level packages
- Install steps
Runtime and execution order
Test order can hide or reveal bugs.
Inspect:
- Parallelization settings
- Retry behavior
- Timeout values
- Order-dependent tests
- Shared setup and teardown logic
Local vs CI checklist
| Area | Local | CI | What to verify |
|---|---|---|---|
| Runtime version | Developer machine | Runner image | Same major/minor version |
| Installed deps | Often cached | Fresh install | Lockfile and package manager |
| Environment variables | Personal shell | Pipeline secrets | Missing or mismatched values |
| Filesystem | Flexible | Restricted | Path casing, permissions, cleanup |
| Speed | Usually faster | Often slower | Wait logic and timeouts |
Step 4 — Isolate the failing test or job
Run one test file or one spec at a time. Disable parallelism temporarily. Remove unrelated steps until the issue is reproducible in a smaller surface area.
Your aim is to narrow the failure to one layer:
- Unit
- Integration
- End-to-end
- Build
- Deployment
- Infrastructure
The smaller the failure surface, the easier the fix.
Step 5 — Classify the failure correctly
Not every CI failure should be treated the same way.
Flaky test
A flaky test passes sometimes and fails sometimes.
It is usually caused by:
- Timing
- Shared state
- Async behavior
- Network dependency
- Non-deterministic assertions
Deterministic regression
A deterministic failure happens every time.
It often appears after:
- A code change
- A dependency upgrade
- A config update
- A changed assumption in the app
CI environment issue
This failure only shows up in the pipeline.
It is often caused by:
- Missing setup
- Permission problems
- Infra instability
- Differences between local and runner environments
Failure classification table
| Category | Behavior | Typical root cause | Best next move |
|---|---|---|---|
| Flaky test | Passes on rerun | Timing or shared state | Stabilize the test |
| Deterministic regression | Fails every time | Product or dependency change | Inspect recent diffs |
| CI environment issue | Only in pipeline | Setup or infra mismatch | Compare environment parity |
CI failure troubleshooting matrix
Start with the symptom, then move to the most likely category. This helps teams avoid the common mistake of treating every CI failure like a code bug.
In many cases, the fastest fix is in the environment, the test design, or the synchronization logic.
| Symptom | Likely cause | First thing to check |
|---|---|---|
| Passes locally, fails in CI | Environment mismatch | Runner image, runtime version, env vars |
| Fails only sometimes | Flaky test | Timing, async behavior, shared state |
| Fails every time | Deterministic regression | Recent code, dependency, or config change |
| Fails after a setup step | Build or install issue | Dependency install, lockfile, toolchain |
| Fails only on one runner | Infra or permissions issue | Resource limits, permissions, filesystem |
| UI test fails on click or wait | Selector or timing issue | Wait logic, selector stability, page state |
| Failure changes on rerun | Non-determinism | Shared data, order dependence, retries |
Step 6 — Fix the root cause, not the symptom
The symptom is rarely the fix. If a test fails because it clicked too early, do not only rerun it. Make the wait logic reliable. If a selector is brittle, replace it. If tests share state, isolate them.
Strong fixes usually include:
- More stable selectors
- Proper synchronization
- Better test isolation
- Cleaner setup and teardown
- Aligned local and CI environments
Step 7 — Add guardrails so the issue does not return
The best CI systems get easier to debug over time. Add guardrails that reduce future guesswork:
- Better logs
- Screenshots on failure
- Video or trace artifacts
- Targeted retries only where justified
- Clear triage ownership
- Alerting for repeated failures
A practical debugging workflow
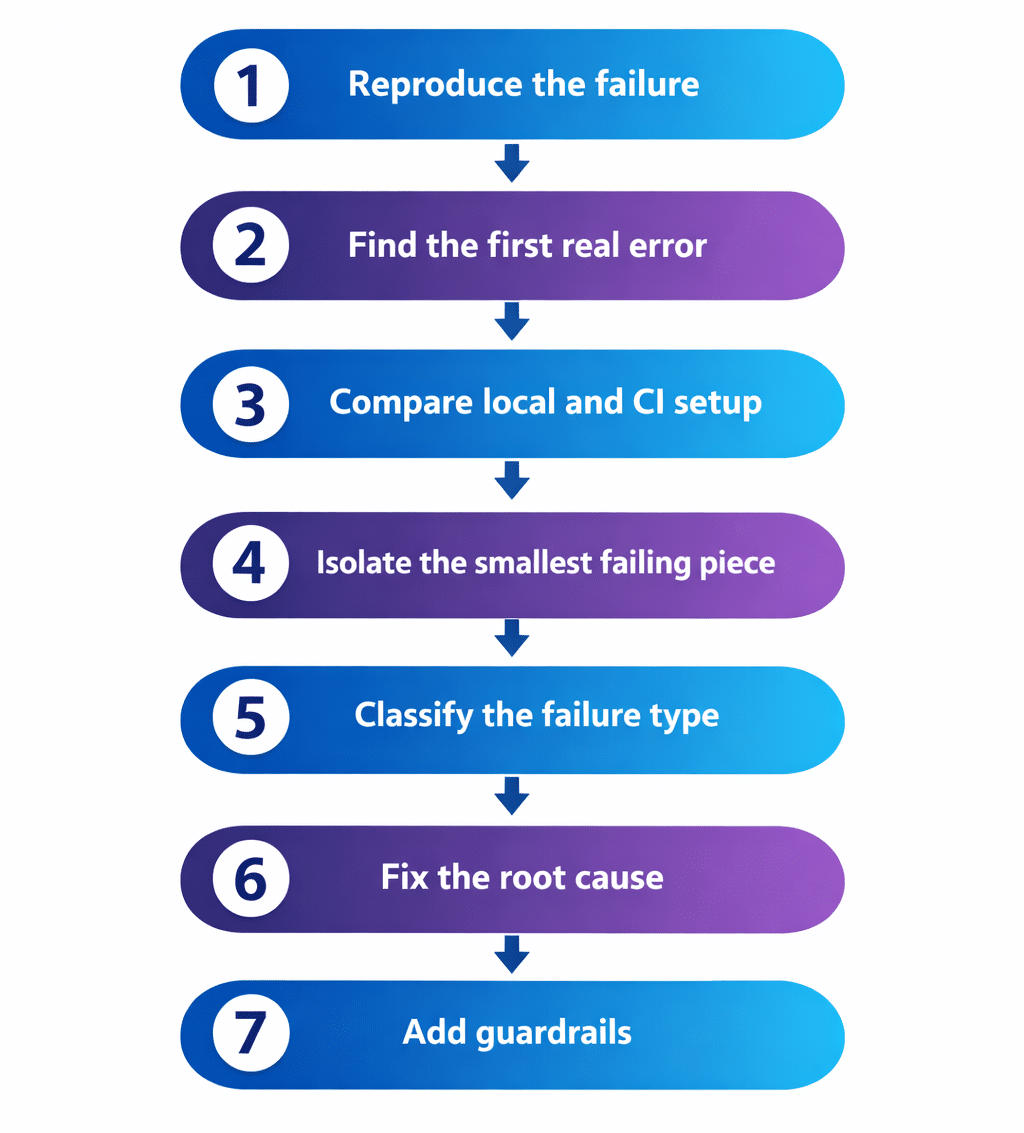
Use this sequence every time:
- Reproduce the failure
- Find the first real error
- Compare local and CI setup
- Isolate the smallest failing piece
- Classify the failure type
- Fix the root cause
- Add guardrails
That routine saves time and reduces unnecessary churn.
How to Automatically Debug CI Failures Using AI
AI is especially useful when logs are long, repetitive, and noisy. It does not replace engineering judgment. It speeds up the search for the right signal.
What AI can do in a CI failure workflow
A strong AI-assisted workflow can:
- Summarize the failing job
- Extract the root error from noisy logs
- Identify likely failure categories
- Compare the current failure against historical patterns
- Recommend the next debugging step
Where AI adds the most value
Noisy logs
CI logs are often too long for manual scanning. AI can compress them into a concise summary and highlight the first meaningful error, not just the last one.
Repeated failures
The same failure may show up again and again. AI can cluster similar failures, detect recurring flaky patterns, and surface regressions that keep returning.
Faster triage
Engineers lose time hunting for context. AI can help them understand the failure faster so they can decide whether to rerun, rollback, or fix.
Test triage and classification
Not every failure should enter the same queue.
AI can help separate:
- Flaky tests from real regressions
- Code issues from infrastructure issues
- Test logic problems from environment problems
AI debugging capability comparison
| AI capability | What it helps with | Why it matters |
|---|---|---|
| Log summarization | Long noisy output | Saves manual reading time |
| Root error extraction | Cascading failures | Finds the first useful clue |
| Pattern matching | Repeat failures | Surfaces recurring issues |
| Failure classification | Triage speed | Guides the right response |
| Historical comparison | Similar past incidents | Speeds up diagnosis |
What a strong AI debugging system should do
The best systems do more than summarize text.
They should:
- Ingest logs, stack traces, screenshots, and artifacts
- Map failure signatures to probable causes
- Rank possible causes by confidence
- Suggest remediation steps with context
- Learn from past fixes and feedback
What AI should not do
AI should support debugging, not blur it.
It should not:
- Guess wildly without evidence
- Replace deterministic checks
- Hide flaky failures behind blind retries
- Add more noise than signal
- Be treated as a source of truth without validation
The best outcome is faster human judgment, not automatic hand-waving.
How Panto AI fits into CI failure debugging
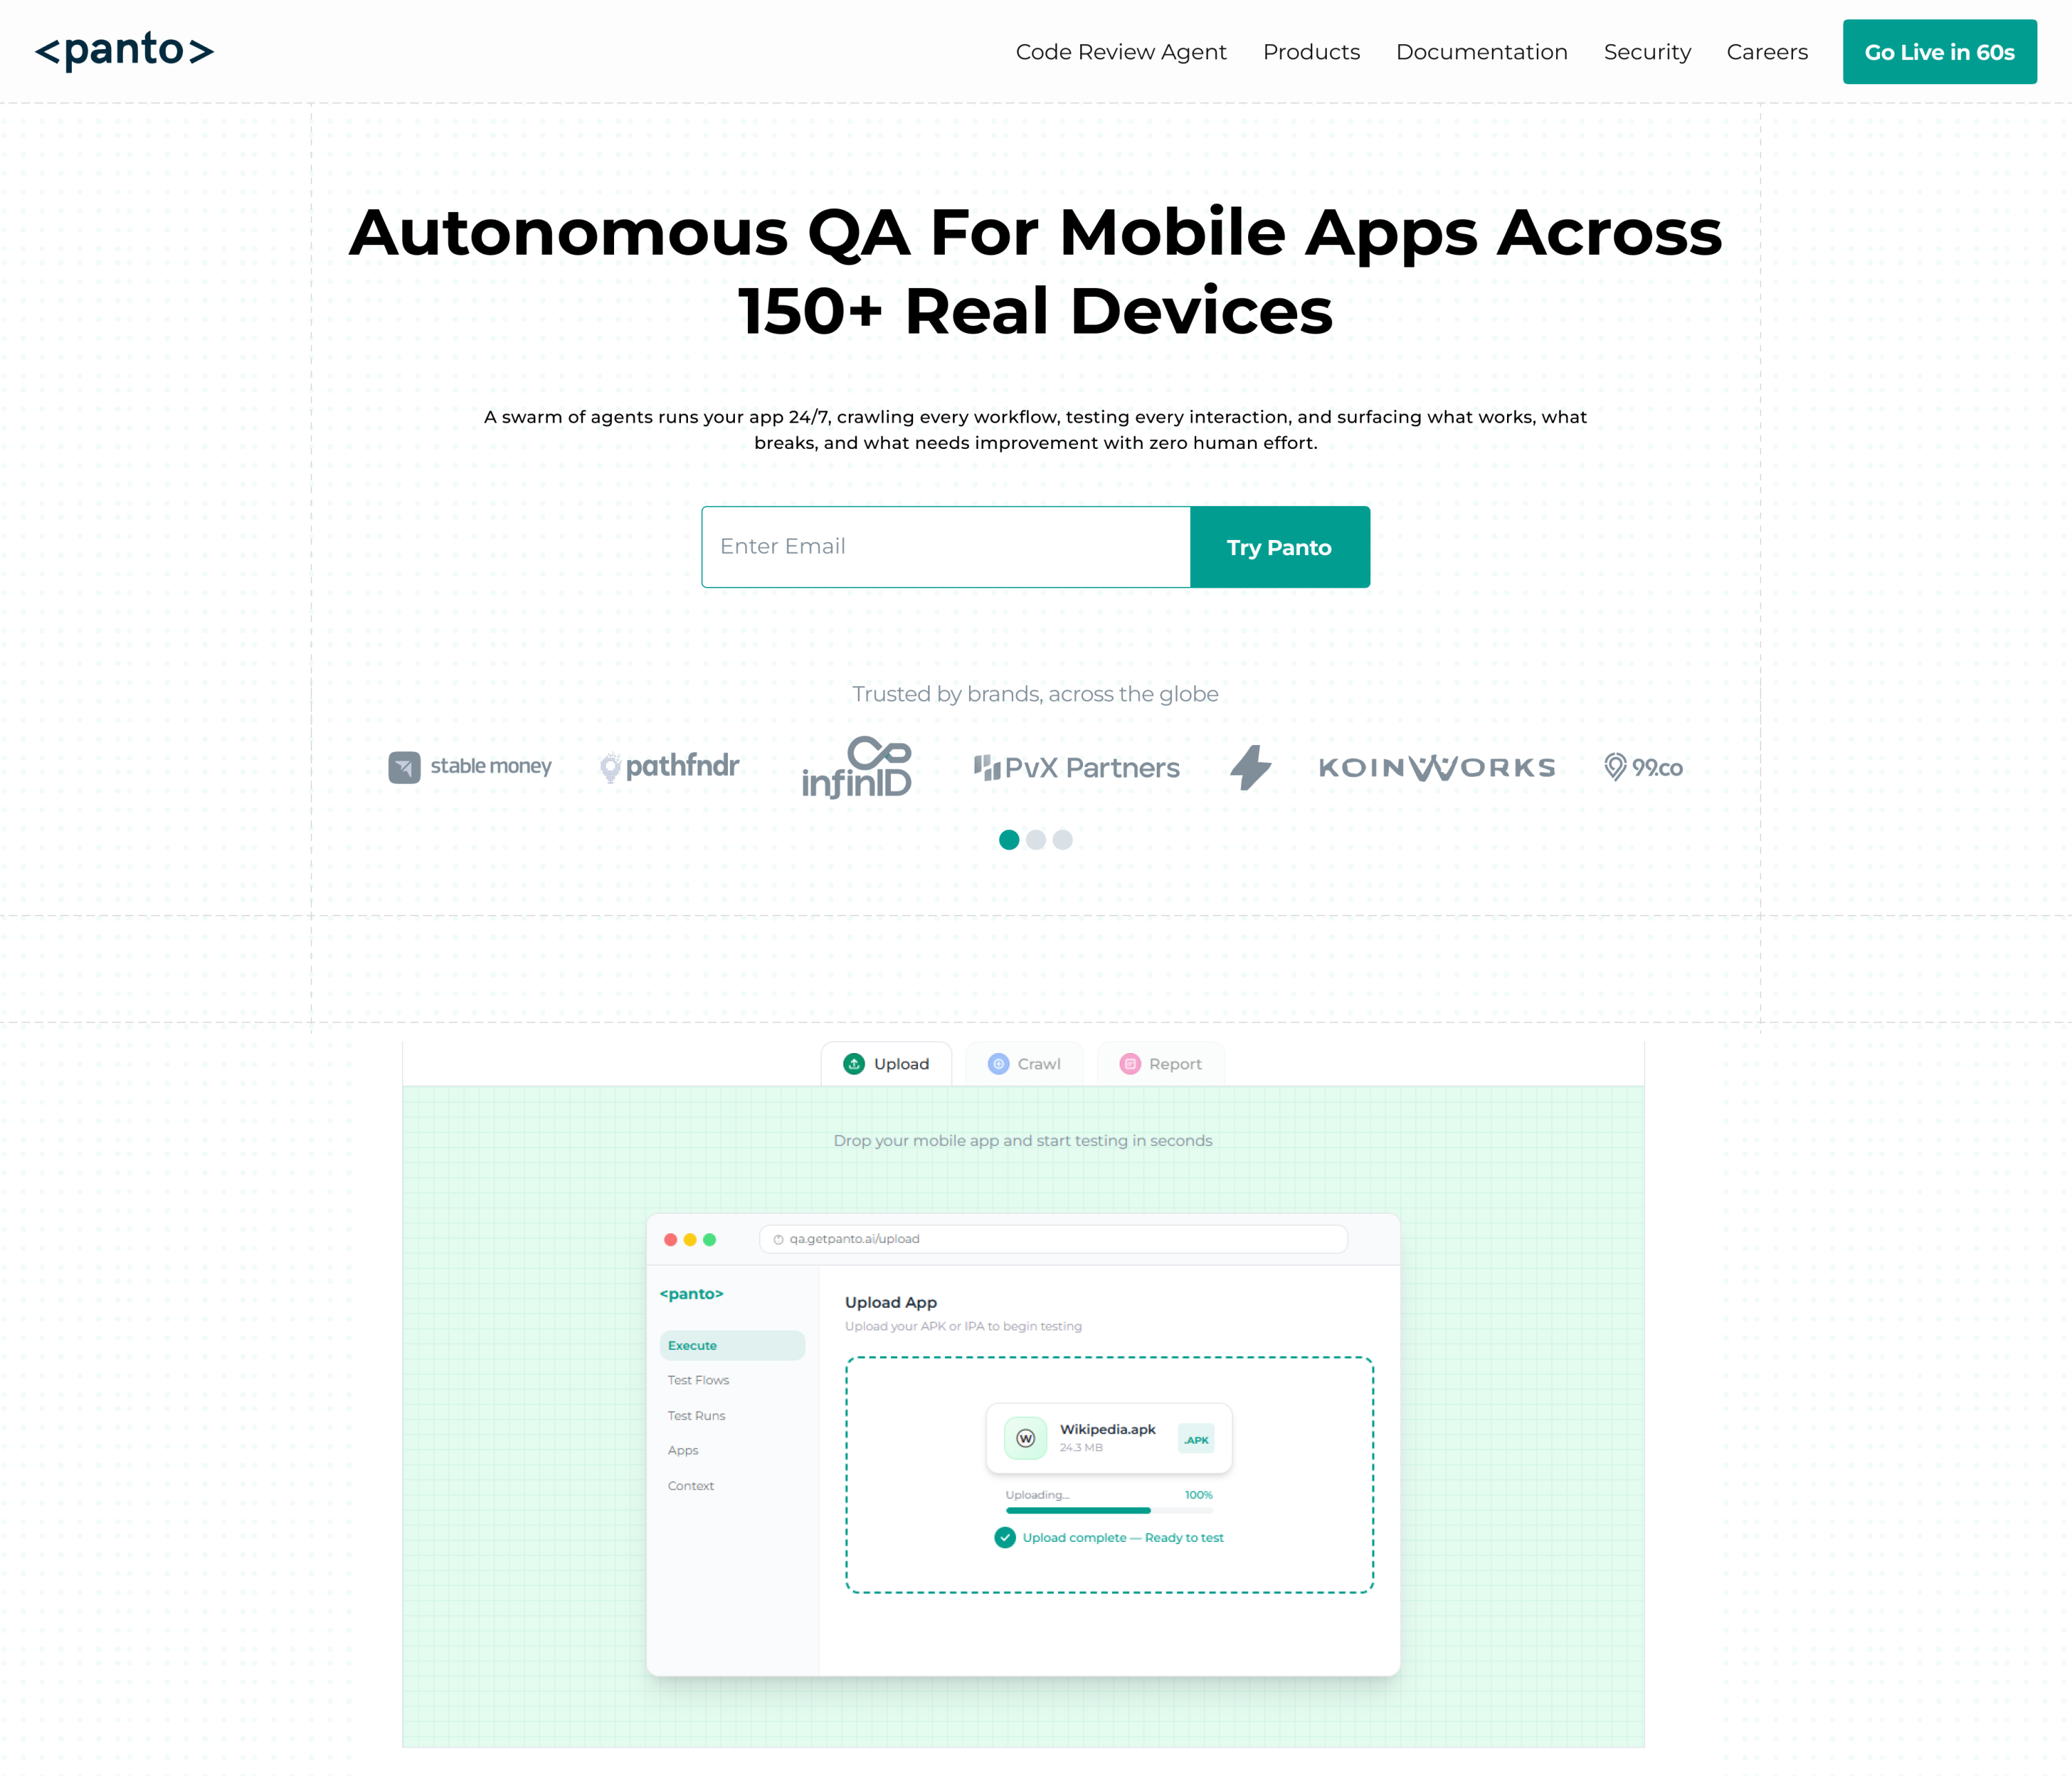
Panto AI helps teams move from manual log-scanning to automated failure analysis.
Instead of asking engineers to read every line of a noisy CI job, Panto can help summarize the failure, identify repeated patterns, and point teams toward the most likely root cause faster.
For teams dealing with flaky tests, this matters because the same failure often repeats in slightly different forms.
A system that can recognize those patterns reduces triage time and makes it easier to distinguish between a true regression, a test issue, and an environment problem.
Panto is especially useful when CI failures are:
- repetitive
- noisy
- hard to classify
- expensive to debug manually
- spread across multiple test suites or services
That makes Panto AI a strong fit for teams that want to improve reliability without adding more manual review overhead.
AI in CI debugging: before vs after
| Stage | Manual approach | AI-assisted approach |
|---|---|---|
| Triage | Read logs line by line | Get a concise summary first |
| Root cause search | Guess and inspect slowly | Review ranked likely causes |
| Recurring failures | Hard to spot across builds | Cluster similar issues automatically |
| Team response | Rerun, ask around, wait | Decide faster with more context |
Conclusion
CI failures are rarely random. They usually come from environment mismatch, flaky tests, dependency drift, or hidden state that local runs do not expose.
Once you follow a consistent debugging process, the pattern becomes easier to spot and fix. The key is to start with the first real error, compare environments carefully, and solve the root cause instead of the symptom.
For teams that want to reduce noise and move faster, AI can make a meaningful difference by turning large failing pipelines into actionable insight.
That is exactly where tools like Panto AI help teams debug CI failures faster, identify flaky tests automatically, and keep delivery moving with more confidence.
FAQ’s
Q: Why do tests pass locally but fail in CI?
Because local and CI environments are rarely identical. Differences in runtime versions, environment variables, resource limits, timing, and browser or filesystem behavior can expose bugs that do not appear on a developer machine.
Q: What is the most common reason for CI test failures?
Flaky tests and environment mismatches are among the most common causes. Timing issues, shared state, and dependency drift are especially common in UI and end-to-end pipelines.
Q: How do you debug flaky tests in CI?
Start by reproducing the issue in the same environment, then isolate the failing test, inspect artifacts, compare local and CI setup, and fix the root cause rather than relying on reruns.
Q: Can AI help find the root cause of CI failures?
Yes. AI can summarize logs, detect repeated patterns, classify likely failure types, and help engineers focus on the most probable cause faster.
Q: What is the best way to reduce CI pipeline noise?
Improve test isolation, capture better artifacts, avoid blind retries, and use tooling that can distinguish flaky failures from real regressions.
Q: How do you know if a CI failure is flaky?
If the failure passes on rerun or changes behavior across runs, it is often flaky. If it fails every time in the same way, it is more likely a deterministic regression or environment issue.