Artificial intelligence tools have scaled faster than almost any technology in history. ChatGPT alone reached 900 million weekly active users by late March 2026, a figure that took Facebook over a decade to reach.
The broader AI market stood at $390.9 billion in 2025 and is projected to hit $3.5 trillion by 2033 at a 30.6% compound annual growth rate. From boardrooms to developer terminals to government offices, AI coding and review tools have become operational infrastructure, not experimentation.
This article compiles the most authoritative AI tools statistics available as of 2026. It covers total user figures, usage patterns, enterprise adoption, developer and API data, country-level adoption, competitive market share, and the broader industry trajectory.
AI Tools Statistics Key Insights & Takeaways
- 900 million weekly active users on ChatGPT by late March 2026, up from 400 million in February 2025
- 50 million consumer subscribers on ChatGPT, plus 1 million+ business customers
- $2.52 trillion in worldwide AI spending forecast for 2026, a 44% year-over-year increase
- 88% of enterprises use AI in at least one business function
- $37 billion in enterprise generative AI spending in 2025, a 3.2x year-over-year increase
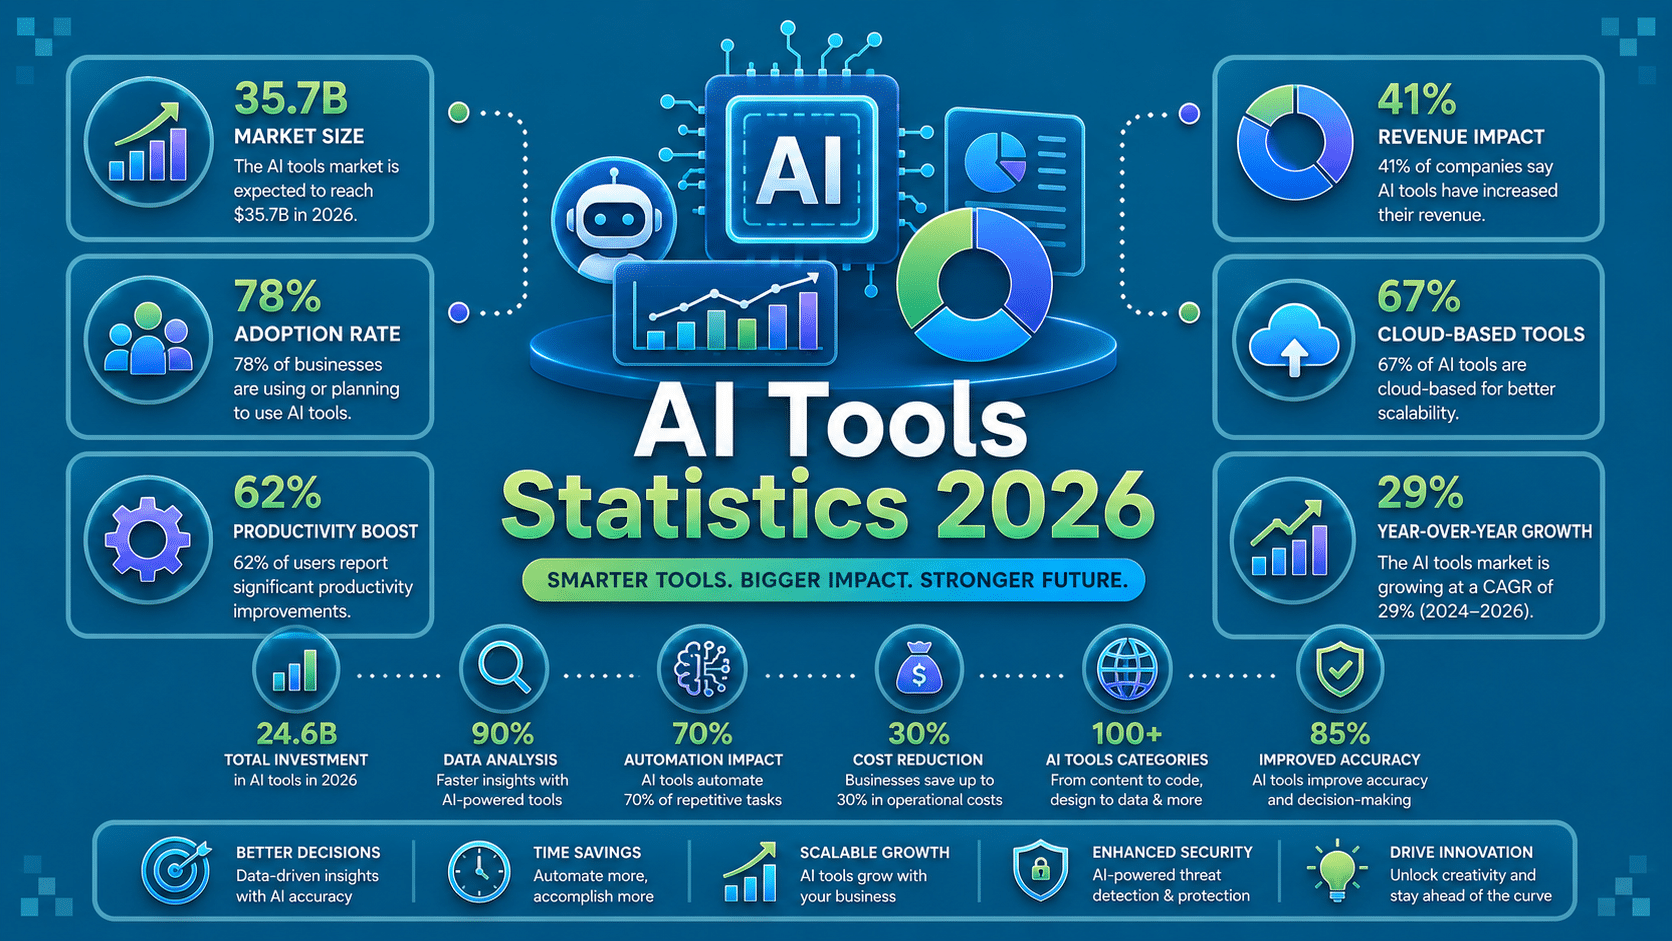
- 84% of developers use or plan to use AI tools, with 51% of professionals using them daily
- GitHub Copilot reached 20 million users by July 2025, deployed at 90% of Fortune 100 companies
- 53% of the global population adopted generative AI within three years of its mass-market launch, faster than the PC or internet
- Gartner predicts 40% of enterprise applications will include task-specific AI agents by end of 2026, up from under 5% in 2025
AI Tools Statistics: At a Glance
| Metric | Figure |
| Global AI market size (2025) | $390.9 billion |
| Global AI market projection (2033) | $3.5 trillion |
| AI market CAGR (2026 to 2033) | 30.6% |
| Worldwide AI spending (2026) | $2.52 trillion |
| ChatGPT weekly active users | 900 million |
| ChatGPT consumer subscribers | 50 million+ |
| ChatGPT daily messages (Jul 2025) | 2.5 billion |
| Generative AI market size (2025) | $22.21 billion |
| Enterprise AI adoption rate | 88% |
| Enterprise GenAI spending (2025) | $37 billion |
| GitHub Copilot total users (Jul 2025) | 20 million |
| ChatGPT web traffic market share | 68% |
| UAE AI adoption (working-age pop.) | 70.1% |
| Average enterprise AI ROI | 5.8x in 14 months |
1. AI Tools Statistics: User Statistics
AI tools have attracted an unprecedented user base across both consumer and enterprise categories. ChatGPT remains the dominant platform by a wide margin.
ChatGPT reached 900 million weekly active users by late March 2026, according to OpenAI, up from 400 million in February 2025. OpenAI also confirmed more than 50 million consumer subscribers and over 1 million business customers. View our blog on ChatGPT statistics →
The platform reached 800 million weekly active users in October 2025, placing it among the top 15 most-visited websites globally. ChatGPT recorded 5.51 billion monthly web visits in April 2026.
In May 2025, OpenAI published its largest-ever analysis of AI usage, examining 1.5 million conversations in collaboration with researchers at Harvard and Duke. It found that 49% of usage is information-seeking, 40% is task completion such as writing or coding, and 11% is exploration and ideation.
AI Tools Statistics: ChatGPT Weekly Active User Growth
| Date | Weekly Active Users |
| November 2023 | 100 million |
| February 2025 | 400 million |
| July 2025 | 700 million |
| October 2025 | 800 million |
| Late March 2026 | 900 million |
Stanford’s 2026 AI Index found that generative AI reached 53% global population adoption within three years of its mass-market launch, outpacing the adoption curve of the personal computer and the internet over comparable timeframes.
2. AI Tools Statistics: Usage & Adoption Statistics
Adoption has moved well beyond early-adopter professionals. AI tools are now embedded in everyday workflows across industries and demographics.
About 21% of the world’s population uses AI tools daily, and 66% use them at least every few months, according to a KPMG study conducted in early 2025. 75% of global knowledge workers now use AI tools regularly, according to Worklytics 2025 AI Adoption Benchmarks.
Workers using generative AI saved 5.4% of their total work hours on average. Harvard Business School research found AI users completed tasks 25.1% faster with over 40% higher quality output.
Controlled studies found workers’ throughput on realistic daily tasks increased by 66% when using AI tools. Frequent users, roughly 27% of the AI-using workforce, save over 9 hours per week.
AI Tools Statistics: AI Tool Use Cases Among Professionals
| Use Case | Share of Users |
| Writing and content creation | 82% |
| Information search and research | 67.5% |
| Coding and software development | ~60% |
| Data analysis | ~40% |
| Image generation | ~33% |
| Customer service / support | ~30% |
Teams using AI report 77% faster task completion and a 45% boost in overall productivity according to 2025 data. MIT studies show AI tools have increased writing speed by 40%. McKinsey estimates generative AI could add $2.6 trillion to $4.4 trillion annually across the use cases it analyzed.
3. AI Tools Statistics: Demographics Statistics
The user base for AI tools spans age groups, sectors, and geographies, though concentration remains highest among working-age, digitally active populations.
As of June 2025, 34% of U.S. adults reported having ever used ChatGPT, up from 18% in July 2023, according to survey data. 82% of senior leaders use generative AI weekly, with 46% using it daily.
88% of leaders say helping their business speed up AI adoption is their top priority in 2025. Globally, 58% of surveyed employees report using AI at work on a semi-regular or regular basis, with that share exceeding 80% in India, China, UAE, and Saudi Arabia.
AI Tools Statistics: AI Tool Adoption Rate by Industry (2025)
| Industry | AI Adoption Rate |
| Education | 86% |
| IT and Telecommunications | 38% |
| Retail / Consumer | 31% |
| Financial Services | 24 to 59% |
| Healthcare | 22% |
| Professional Services | 20% |
| Finance Function (large enterprises) | 59% |
In the finance function specifically, Gartner’s 2025 AI in Finance Survey of 183 CFOs and senior finance leaders found 59% reported using AI, up from 37% in 2023.
4. AI Tools Statistics: Revenue & Financial Statistics
The financial scale of AI tools has grown dramatically, with OpenAI’s revenue serving as the clearest public benchmark.
OpenAI’s annualized revenue crossed $20 billion in 2025 and exceeded $25 billion by February 2026, generating $2 billion per month. Enterprise seats grew 9x year over year, and weekly enterprise messages increased 8x since November 2024. View our complete report on OpenAI’s statistics →
Gartner’s January 2026 forecast put worldwide AI spending at $2.52 trillion in 2026, a 44% year-over-year increase from roughly $1.76 trillion in 2025. This figure covers AI infrastructure, software, services, models, and cybersecurity.
AI infrastructure alone is projected to reach $1.37 trillion in 2026. Note: this is a broad spending aggregate that includes hardware and is not directly comparable to narrower software market-size estimates.
The global AI market overall was $390.91 billion in 2025 and is projected to reach $3.5 trillion by 2033, at a CAGR of 30.6%, per Grand View Research. The generative AI segment specifically was valued at $22.21 billion in 2025 by Grand View Research, on a separate, more conservative definition than mixed estimates citing higher figures.
AI Tools Statistics: OpenAI Revenue and Scale (2025 to 2026)
| Metric | Figure |
| OpenAI annualized revenue (Feb 2026) | $25 billion+ |
| OpenAI monthly revenue run rate | $2 billion |
| ChatGPT consumer subscribers | 50 million+ |
| OpenAI business customers | 1 million+ |
| Enterprise seats YoY growth | 9x |
| Weekly enterprise messages growth | 8x since Nov 2024 |
5. AI Tools Statistics: Enterprise Adoption Statistics
Enterprise is now the primary growth engine for AI tools revenue and deployment.
95% of U.S. companies are now using generative AI, characterized by Bain as “unprecedented uptake” surpassing previous enterprise technology adoption curves including cloud computing and mobile.
Enterprise generative AI spending reached $37 billion in 2025, a 3.2x year-over-year increase. Gartner projects more than 80% of enterprises will deploy GenAI-enabled applications in production by 2026. Enterprises run an average of 200 AI tools simultaneously.
Gartner predicts 40% of enterprise applications will be integrated with task-specific AI agents by the end of 2026, up from less than 5% in 2025. In its best-case scenario, agentic AI could drive approximately 30% of enterprise application software revenue by 2035, surpassing $450 billion, up from 2% in 2025.
OECD data shows 20.2% of firms globally reported using AI in 2025, up from 14.2% in 2024 and 8.7% in 2023. Adoption has more than doubled in two years. Eurostat’s official EU enterprise survey found 19.95% of EU enterprises used AI technologies in 2025, up from 13.5% in 2024, with 55.03% of large EU enterprises using AI.
AI Tools Statistics: Enterprise AI Adoption Metrics (2025 to 2026)
| Metric | Figure |
| U.S. companies using GenAI | 95% |
| Global enterprise AI adoption | 88% |
| Enterprise GenAI spend (2025) | $37 billion |
| Average AI tools per enterprise | 200 |
| OpenAI workplace seats (ChatGPT for Work) | 7 million+ |
| OpenAI business customers | 1 million+ |
| Fortune 100 using GitHub Copilot | 90% |
| OECD firm-level AI adoption (2025) | 20.2% |
| EU enterprise AI adoption (2025) | 19.95% |
| Large EU enterprises using AI (2025) | 55.03% |
| Enterprise AI ROI (average) | 5.8x in 14 months |
65% of enterprises increased their AI budgets in 2026, with a median year-over-year increase of 22%. Customer service (56%), IT operations (51%), and marketing (48%) are the top three departments using AI in production.
6. AI Tools Statistics: Market Share and Competitive Statistics
The generative AI market remains highly concentrated at the top, though the competitive landscape is shifting rapidly.
ChatGPT and Gemini together control over 86% of global website traffic for generative AI tools. ChatGPT’s share of generative AI web traffic fell from 87.2% in early 2025 to approximately 68% by December 2025, then to 56.72% by March 2026.
Google Gemini surged from 6% to 25.46% over the same window, the largest share gain by any AI chatbot tracked. Anthropic’s Claude grew from 1.4% to 6.02%.
AI Tools Statistics: Chatbot Market Share Comparison (2025 to 2026)
| Platform | Jul 2025 Share | Dec 2025 Share | Mar 2026 Web Traffic |
| ChatGPT | ~60.5% | ~68% | 56.72% |
| Google Gemini | ~13.5% | ~18.2% | 25.46% |
| Microsoft Copilot | ~14.3% | ~9.35% (US) | not reported |
| Perplexity | ~6.2% | not reported | not reported |
| Claude (Anthropic) | ~3.2% | not reported | 6.02% |
ChatGPT accounts for 62.5% of the market share of B2C subscription sales of AI tools. The market is diversifying: Claude held ChatGPT’s top Cloudflare AI ranking position for all of Q1 2026, before GPTBot retook the lead by May 2026.
7. AI Tools Statistics: Developer and API Statistics
Developers are among the highest-intensity users of AI tools, and the developer ecosystem has become a core battleground for platform growth.
84% of developers say they use or plan to use AI in their development process, up from 76% the prior year. About 51% of professional developers use AI tools every day.
ChatGPT (82%) and GitHub Copilot (68%) are the clear market leaders among developers, serving as the primary entry point for most developers using AI assistance, according to the 2025 Stack Overflow Developer Survey.
GitHub Copilot reached 20 million cumulative users in July 2025. The AI coding assistant generates 46% of code written by its users, with Java developers reaching 61%, and has been adopted by 90% of Fortune 100 companies. GitHub Copilot had 4.7 million paid subscribers by January 2026, up approximately 75% year over year. Check out our GitHub Copilot statistics →
AI Tools Statistics: Developer Tool Comparison (2025 to 2026)
| Tool | Users / Scale | Key Metric | Enterprise Reach |
| GitHub Copilot | 20M total users (Jul 2025) | 46% of code written | 90% Fortune 100 |
| ChatGPT (API and developer) | 900M WAU across all tiers | 82% developer usage | 7M+ workplace seats |
| Google Gemini (developer) | 750M app users (all tiers) | 25.46% web traffic | Via Google Cloud |
Microsoft’s controlled research involving 4,800 developers found developers completed tasks 55.8% faster using GitHub Copilot, and were 78% more likely to complete tasks successfully. Pull request time dropped from 9.6 days to 2.4 days, a 75% reduction in development cycle time.
A majority of developers (52%) either don’t use AI agents or stick to simpler AI tools, and 38% have no plans to adopt agents, indicating that agentic coding remains in early stages.
8. AI Tools Statistics: Regional and Country Adoption Statistics
AI tool adoption varies sharply by country, with small, digitally advanced economies often outpacing much larger markets in per-capita penetration.
According to Microsoft’s Global AI Diffusion Report for Q1 2026, global AI usage reached 17.8% of the world’s working-age population, up from 16.3% in the second half of 2025. The UAE led at 70.1%, Singapore at 63.4%, and Norway at 48.6%. The United States ranked 21st at 31.3%, up from 24th the prior period.
Stanford’s 2026 AI Index uses a different methodology and found Singapore at 61%, UAE at 54%, and the U.S. at 28.3%, ranking 24th globally. Despite leading the world in AI investment and model development, the U.S. lags well behind smaller, more digitally integrated economies in per-capita adoption.
The AI adoption gap between the Global North and Global South continues to widen. In Q1 2026, 27.5% of the Global North working-age population used generative AI, versus 15.4% in the Global South .
AI Tools Statistics: Adoption by Country (Q1 2026)
| Country | Microsoft AI Diffusion Report (Q1 2026) | Stanford AI Index 2026 | Notable Context |
| UAE | 70.1% | 54% | National AI strategy since 2017 |
| Singapore | 63.4% | 61% | Government investment of $743M through 2027 |
| Norway | 48.6% | not reported | Top European market |
| Ireland | 48.4% | not reported | Strong tech-sector base |
| France | 47.8% | not reported | Rapidly accelerating in 2025 |
| United Kingdom | 42.2% | not reported | Ranked 8th globally |
| United States | 31.3% | 28.3% | Ranks 21st and 24th respectively |
| Global average (working-age) | 17.8% | 53% GenAI adoption | Different methodologie |
At the EU enterprise level, Denmark (42.0%), Finland (37.8%), and Sweden (35.0%) lead regional adoption, while Romania (5.2%), Poland (8.4%), and Bulgaria (8.5%) trail, according to Eurostat’s 2025 ICT Enterprise Survey.
Notable regional development: South Korea, Thailand, and Japan saw the greatest acceleration in AI adoption during Q1 2026, driven partly by improved AI capabilities in Asian languages .
9. AI Tools Statistics: Market Trends and Industry Growth
Several structural forces are accelerating AI tool adoption beyond any single application or platform.
88% of organizations now use AI in at least one business function. Gartner’s January 2026 forecast put worldwide AI spending at $2.52 trillion for 2026, a 44% year-over-year increase, driven heavily by AI infrastructure investment. AI-optimized server spending alone is projected to rise 49% in 2026, representing 17% of total AI expenditure.
By 2028, at least 15% of day-to-day business decisions will be made autonomously through agentic AI, up from 0% in 2024 . By 2028, 33% of enterprise software applications will include agentic AI, up from less than 1% in 2024 .
Employees using AI report an average 40% productivity boost, with controlled studies showing 25 -55% improvements depending on the function. The estimated value of generative AI tools to U.S. consumers reached $172 billion annually by early 2026, with the median value per user tripling between 2025 and 2026 .
41% of employers worldwide intend to reduce their workforce within five years due to AI automation and AI automation tools (such as Panto AI). 97 million new roles may emerge to partially offset displacement.
AI Market Growth Forecast (2025 to 2033)
| Year | Global AI Market Size | Worldwide AI Spending |
| 2025 | $390.9 billion | ~$1.76 trillion |
| 2026 | not separately reported | $2.52 trillion |
| 2027 | not separately reported | $3.3 trillion |
| 2030 | ~$827 billion (market) | not reported |
| 2033 | $3.5 trillion (market) | not reported |
Conclusion
AI tools have crossed every meaningful threshold for mass adoption, and these AI tools statistics show just that. ChatGPT has 900 million weekly active users and 50 million paying consumers. Enterprises globally spend $37 billion annually on generative AI.
GitHub Copilot is present at 90% of Fortune 100 companies. Gartner forecasts $2.52 trillion in total worldwide AI spending in 2026 alone. These numbers reflect verified deployments, paid subscriptions, and disclosed revenue from the world’s largest technology companies.
This shows that AI is no longer an industry trend. It is becoming general-purpose economic infrastructure, and the data from 2026 confirms that transition is already well underway.
FAQ’s
Q: How many people use AI tools globally?
A: AI adoption has reached mainstream scale. OpenAI reported that ChatGPT alone surpassed 900 million weekly active users by March 2026. Stanford’s AI Index 2026 found that generative AI reached 53% global population adoption within just three years of its mass-market launch, while KPMG reported that 21% of the world’s population uses AI tools daily.
Q: What is the market size of the AI tools industry?
A: The global AI market was valued at approximately $390.9 billion in 2025, according to Grand View Research. Gartner projects a much larger figure of $2.52 trillion in worldwide AI spending by 2026, though that broader estimate includes AI infrastructure, hardware, and related technologies in addition to software tools.
Q: Which companies have the highest AI tool adoption?
A: AI adoption is now widespread across large enterprises. Surveys show that 95% of U.S. companies use generative AI in some capacity. GitHub Copilot is deployed at 90% of Fortune 100 companies, while OpenAI reports more than 1 million business customers and over 7 million ChatGPT for Work seats.
Q: What is the ROI of AI tools for enterprises?
A: Enterprise AI investments are delivering measurable returns. McKinsey’s Global AI Survey 2025 found that organizations achieved an average 5.8× return on investment within roughly 14 months of deployment. Early adopters also reported average gains of 15.2% cost savings and 22.6% productivity improvement.
Q: Which country has the highest AI adoption rate?
A: The answer depends on the methodology used. Microsoft’s Global AI Diffusion Report ranked the United Arab Emirates (70.1%) first among working-age populations, followed by Singapore (63.4%) and Norway (48.6%). Stanford’s AI Index used a different framework and ranked Singapore (61%) ahead of the UAE (54%), with the United States at 28.3%.
Q: How fast are developers adopting AI tools?
A: Developer adoption continues to accelerate. Recent surveys show that 84% of developers use or plan to use AI tools, up from 76% the previous year. GitHub Copilot reached 4.7 million paid subscribers by January 2026, representing approximately 75% year-over-year growth. Industry estimates also suggest AI now helps generate or assist with roughly 41% of all code written.
Q: What is ChatGPT’s market share?
A: ChatGPT remains the dominant AI chatbot, though competition is increasing. It accounted for approximately 68% of global AI chatbot web traffic in December 2025, down from 87.2% a year earlier as competitors gained traction. Google Gemini reached approximately 18.2% of chatbot web traffic during the same period. In the consumer subscription market, ChatGPT still represented roughly 62.5% of all AI tool subscriptions.