On September 12, 2025, Cloudflare engineers accidentally “DDoSed” their own infrastructure when a botched dashboard update triggered endless API calls to their Tenant Service. The faulty React code caused the dashboard to flood Cloudflare’s control-plane API with redundant requests, effectively overwhelming the service. Within minutes the Tenant Service went down, which cascaded into broader API and dashboard outages. The incident lasted about three hours before fixes were applied – though, importantly, the core Cloudflare network remained unaffected. In short, a simple coding mistake in the management dashboard led to a self-inflicted DDoS, disrupting Cloudflare’s control plane.
Timeline of the Outage
- Sep 12, 16:32 UTC: Cloudflare releases a new dashboard version containing a bug.
- 17:50 UTC: A new Tenant Service API deployment goes live.
- 17:57 UTC: The Tenant Service becomes overwhelmed (outage begins) as the bug causes repeated calls.
- 18:17 UTC: After scaling up resources, Tenant API availability climbs to 98%, but the dashboard remains down.
- 18:58 UTC: Engineers remove some error codepaths and publish another Tenant API update; this “fix” backfires, causing a second impact.
- 19:01 UTC: A temporary global rate-limit is applied to throttle traffic to Tenant Service.
- 19:12 UTC: Faulty changes are fully reverted and the dashboard is restored to 100% availability.
Cloudflare’s engineering leaders later noted that automatic alerts helped the team respond quickly, and strict separation of services confined the failure to the control plane (dashboard/APIs), not the data plane.
Root Cause: The React useEffect Bug
The investigations revealed that a coding error in the React-based dashboard triggered the outage. A useEffect hook recreated an object in its dependency array on every render. Since React treats this object as “always new,” the effect kept firing repeatedly. In practice, that meant one dashboard render generated many identical API calls instead of just one.
This runaway loop of requests coincided with a simultaneous Tenant Service deployment, compounding the instability and ultimately overwhelming the service. In essence, a simple regression test might have caught that missing dependency – but once in production, it instantly became a self-inflicted DDoS.
Containing the Incident
Cloudflare’s immediate response focused on rate-limiting and resource scaling to keep the Tenant Service alive. They installed a global rate limit on the API and spun up additional pods for the service. While this helped bump service availability, it wasn’t enough to fully restore normal operation. The team attempted a patch to suppress errors, but it ironically made things worse, so they quickly reverted it. Finally, by 19:12 UTC they rolled back the buggy deployment, removing the faulty dashboard changes. With the code fixed and capacity restored, the system stabilized.
Key steps in the recovery included:
- Throttle traffic: A global API rate-limit was applied to cap the flood of requests.
- Scale up resources: Cloudflare increased the number of pods serving the Tenant Service, giving it more throughput.
- Rollback bad code: The team rolled back the bad code: they reverted the erroneous dashboard changes and any problematic service updates, ending the loop of retries.
- Improve monitoring: Alerts and logs guided the team; they later noted adding metadata (e.g. “retry vs new request” flags) for better observability.
After the team removed the faulty code and increased capacity, the dashboard and APIs returned to normal. Cloudflare apologized for the disruption and has since prioritized additional safeguards. For example, they are accelerating the migration of services (including the Tenant Service) to Argo Rollouts, which would automatically rollback a bad deployment on error. They also plan to add random delays to dashboard retry logic to prevent a “thundering herd” of requests on restart.
Lessons Learned from the DDOS outage
This incident, though brief, underscored several lessons for large-scale deployments:
- Observability is vital: Better real-time monitoring and logging (e.g. distinguishing retries from new requests) can surface anomalous traffic patterns faster.
- Deployment safeguards: Automated rollbacks (Argo Rollouts) and canary testing could have prevented the bad change from impacting production.
- Capacity planning: The Tenant Service was under-provisioned for this load spike. Post-incident, Cloudflare allocated more resources to handle bursts.
- Code review and testing: Thorough code reviews and automated tests (including integration tests for dashboards) might have caught the faulty hook before release.
In summary, even top tech companies can accidentally “shoot themselves in the foot” without robust checks at every layer – from observability to CI/CD process.
How Automated Code Review & Analysis Tools could have helped?
One powerful safeguard is the use of automated code review and analysis tools during development. These tools catch bugs early and enforce quality standards before code reaches production. In broad terms:
- What is a code review tool? It’s software that helps developers examine and discuss code changes. Such tools integrate with version control (GitHub, GitLab, Azure Repos, etc.) and streamline collaboration. They speed up reviews, ensure code meets quality standards, and track issues.
- What is a code analysis tool? It’s an automated scanner that examines source code to find issues – from syntax errors to security vulnerabilities – often before the code even runs. Static analysis (SAST) tools, linters, and security scanners fall into this category; they highlight potential bugs, non-compliance with style guides, and risky code patterns.
By integrating these automated tools into the CI/CD pipeline, teams “shift left” quality. The system analyzes every commit or pull request and flags errors instantly. Modern AI-powered code review tools take this further by using machine learning to provide contextual feedback. These tools can generate PR summaries, suggest fixes, and even chat with developers about code changes.
These AI code review tools are especially useful in fast-moving DevOps environments. They act as a “first pass” reviewer, catching obvious errors so human reviewers can focus on architecture and logic. For example, Panto’s agent supports “30+ languages” and “30,000+ security checks” to boost review accuracy.
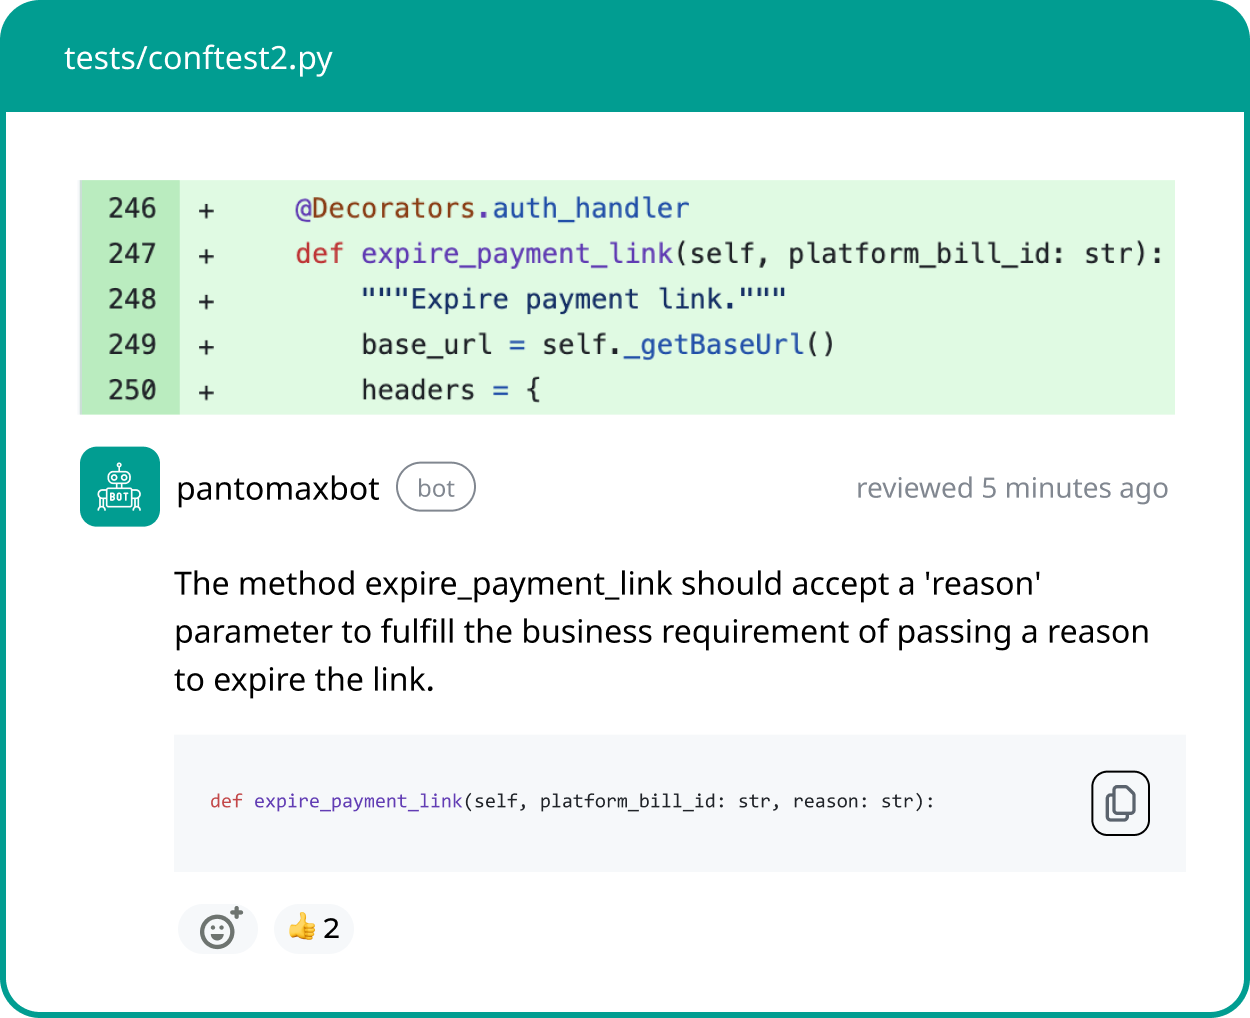
While many products exist, consider the hypothetical role of Panto AI in this scenario. Panto’s platform provides automated, context-driven code reviews on pull requests. If Cloudflare’s dashboard code changes had run through an agent like Panto, it could have flagged the problematic useEffect logic before merging. Panto’s agent learns from the project’s code and associated documentation (Jira, Confluence, etc.), so it could have recognized that the new object in the dependency array causes a perpetual loop. In effect, Panto would serve as a “seatbelt” in the CI/CD pipeline, preventing such a logic bug from ever reaching production.
While no tool is perfect, this example shows how automated code review could have avoided the fiasco. By catching code smells and logical errors early, teams reduce the risk of incidents. In Cloudflare’s case, even a simple linter or code analysis rule (e.g. “no new object in useEffect dependency”) would have flagged the mistake.
Key Takeaways
- Thorough code review prevents outages: Combining human review with automated tools (static analyzers, AI agents) can catch critical bugs early. Tools explicitly called “code review tools” help developers collaborate and enforce standards. “Code analysis tools” automatically scan for errors and vulnerabilities. Together, these automated code quality tools ensure safer releases.
- Use AI-assisted reviews: AI code review tools (like Panto, CodeRabbit, BrowserStack CQ) add a layer of intelligent checking. They can integrate into Azure DevOps or other pipelines, providing PR comments and summaries so issues don’t slip through. The Cloudflare outage shows why investing in such tools (“the best AI code review tool” is whichever fits your workflow) is worthwhile.
- Fail-safe deployments: Beyond code reviews, adopt deployment safeguards (auto-rollbacks, canaries) and robust monitoring. Cloudflare’s post-mortem noted that having Argo Rollouts in place would have auto-reverted the bad change. Automated alerts and capacity planning are equally crucial.
In conclusion, Cloudflare’s self-inflicted downtime highlights that even experts need strong code governance. Modern DevOps teams should leverage the full range of automated code review and analysis tools – from linters to AI agents – to maintain high quality. By doing so, they can prevent simple bugs from snowballing into major outages.